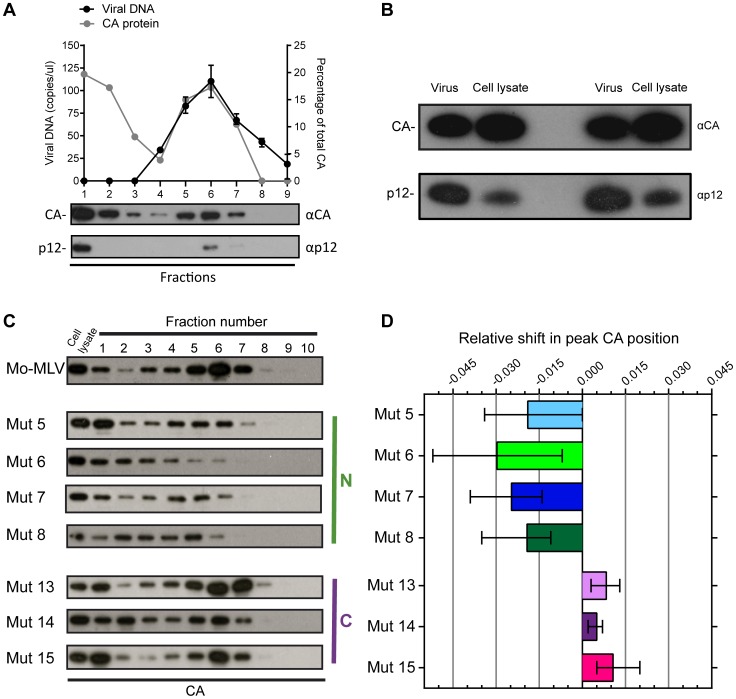
Figure 2. The effect of p12 mutations on the biophysical properties of the Mo-MLV RTC.
(A) D17 cells were infected for four hours with wild type Mo-MLV, and cell lysates were separated using velocity sedimentation through a 10–42% (w/w) sucrose gradient. Fractions were analysed by qPCR with primers targeted to strong stop viral cDNA and proteins were precipitated and analysed by immunoblotting using anti-CA (top blot) and anti-p12 monoclonal (bottom blot) antibodies (Fraction 1 is the top of gradient). The graph displays the copies of viral DNA per microliter (black line) and the percentage of total CA in each fraction (grey line). (B) Wild type Mo-MLV was used to challenge D17 cells and after four hours the cells were lysed (cell lysate). An aliquot of the Mo-MLV VLPs used for the infection was also lysed (virus) and both samples were analysed by immunoblotting with anti-CA (top panel) and anti-p12 (bottom panel) monoclonal antibodies. Two repeats of this experiment are shown in the immunoblot. (C) Infected cell lysates from D17 cells challenged with wild type or p12 mutant Mo-MLV VLPs were separated using velocity sedimentation through a 10–42% (w/w) sucrose gradient and analysed by immunoblotting for CA. (D) For each experiment, the intensity of the CA signal on the immunoblot was determined and the relative shift in the peak CA position compared to wild type RTCs was calculated. The mean and range of at least three independent experiments are displayed.

