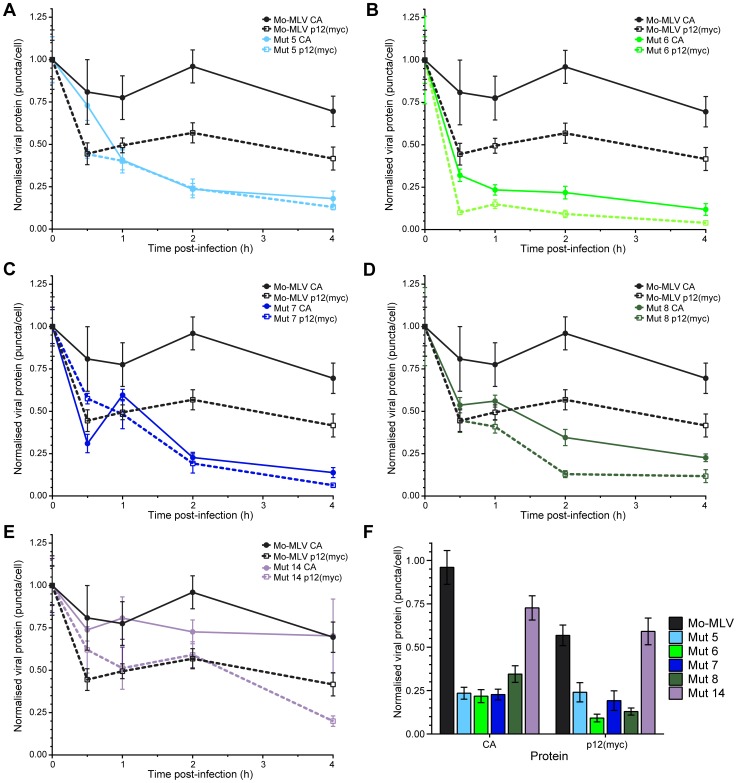
Figure 7. Kinetics of p12 and CA loss from cells infected with Mo-MLV.
Ten cells were randomly chosen (based solely on nuclear stain) and imaged using a spinning disk confocal microscope. The numbers of p12(myc) or CA puncta in each cell were determined. The mean number of puncta per cell was normalised to the mean number of CA or p12(myc) puncta present at time point zero for each infection. The amount of p12 (dashed lines) and CA (solid lines) puncta are displayed against time in the graphs for: (A) p12 mutant 5, (B) p12 mutant 6, (C) p12 mutant 7, (D) p12 mutant 8 and (E) p12 mutant 14. Wild type Mo-MLV data (p12, black dashed and CA, black solid lines) are also plotted in each graph as a reference. Each point indicates the mean with SEM error bars. (F) The normalised numbers of CA and p12(myc) puncta in cells two hours post-infection are displayed as a bar chart showing the mean with SEM error bars.

