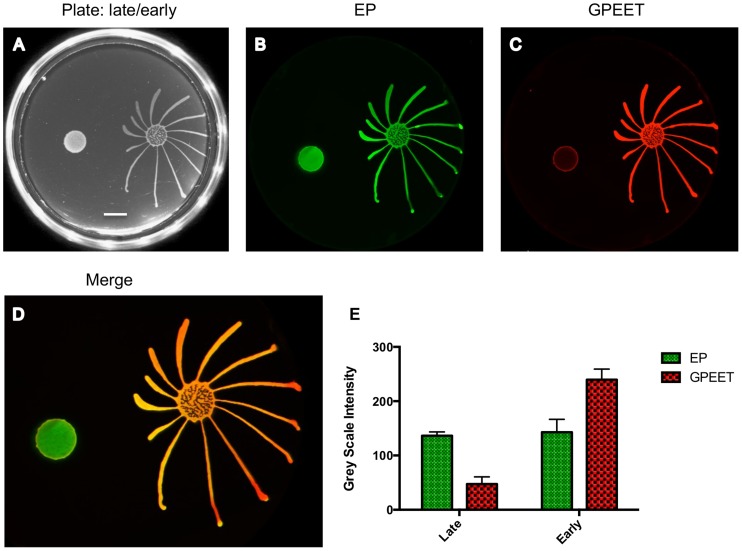
Figure 2. Only GPEET-positive cells exhibit SoMo.
2×10⁵ procyclic forms growing in medium with or without 20 mM glycerol were inoculated on an agarose plate containing 20 mM glycerol. (A) Photograph of the community 5 days post plating. Scale bar is 1 cm. (B–D) A community lift incubated with α-EP and α-GPEET antibodies. (E) Quantification of signal intensities. The intensity of EP is comparable between the early and the late procyclic communities. GPEET is predominantly expressed in the early, migrating colony. The error bar shows the mean standard deviation of seven individual areas.

