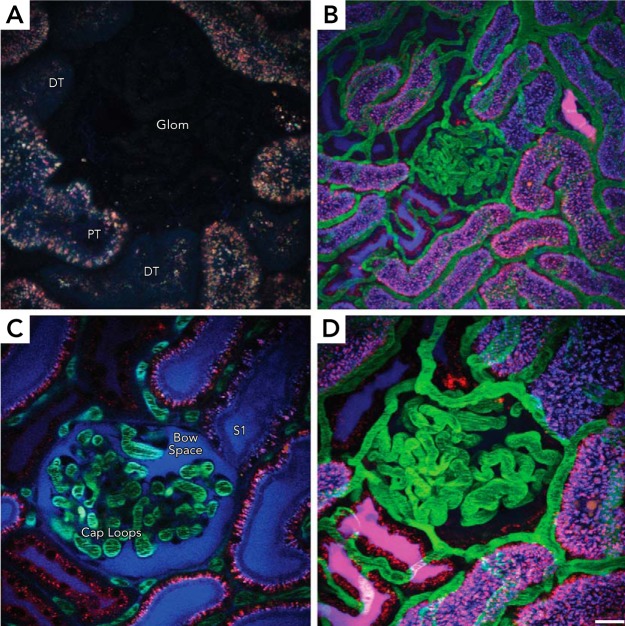
FIGURE 3.
In vivo multiphoton imaging of surface glomeruli in Munich Wistar rats
A: endogenous lysosomal auto-fluorescence in cell types in the kidney: PTs comprise most of the surface and are distinguished by their orange/brown fluorescence, whereas DTs appear darker with less autofluorescence. The glomerulus (Glom) is largely devoid of any autofluorescence, appearing as an empty circular space. B: a low-power micrograph of a three-dimensional volume shows the peritubular vasculature and glomerulus (middle) outlined with a large 150-kDa fluorescein dextran (green). Small 3-kDa dextrans labeled with either Texas Red (red) or Cascade Blue (blue) were introduced sequentially, filtered, and internalized by endocytosis in PTs (punctate accumulation); localization of these dextrans in the lumens of DTs appears as solid magenta or blue accumulations. C: single-plane image with a glomerulus in cross section (middle) with the capillary loops (Cap Loops) filtering out an additional bolus of the 3-kDa Cascade Blue dextran (blue) into the Bowman's space (Bow Space); the S1 segments is seen adjacent to the glomerulus. Red blood cells (RBCs) circulating within capillary loops and surrounding peritubular vessels appear as dark streaks from lack of dextran uptake. D: the PTs, seen in high power, show prominent accumulation of the two dextrans (appearing as punctate structures) within the endosomal pool; a DT (bottom left) is readily distinguished by the presence of the red and blue dextran in the lumen. A second DT (top left) is seen with a faint accumulation of the Cascade Blue dextran in the lumen. Scale bars = 20 μm in A, C, and D, and 40 μm in B.

