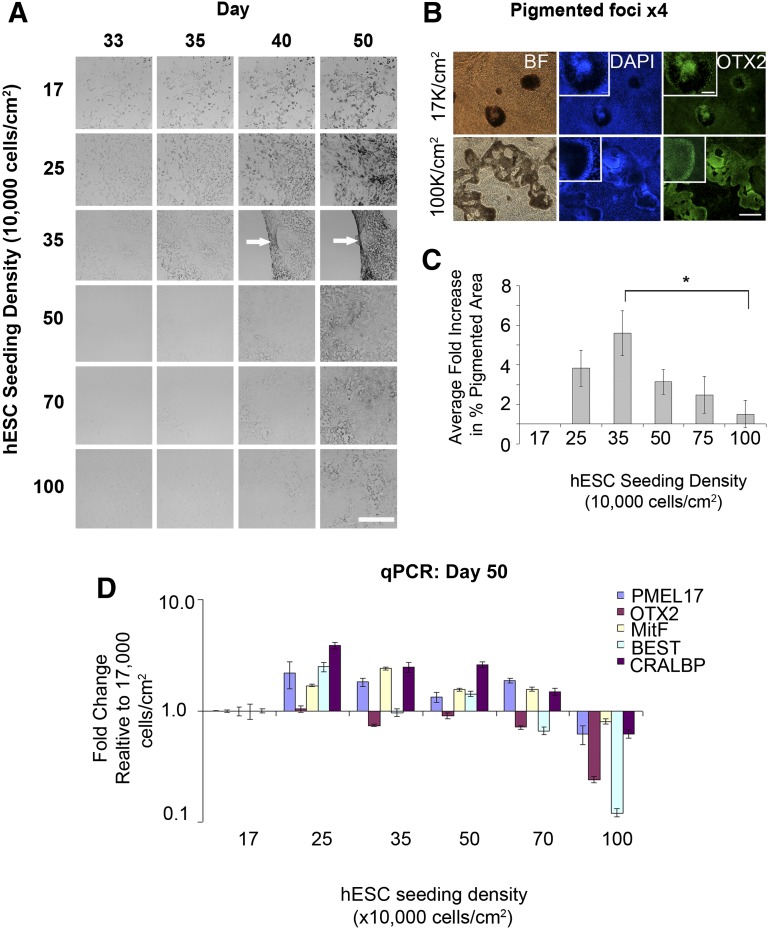
Figure 4.
Optimal seeding density for retinal pigment epithelium (RPE) differentiation. (A): Images of differentiating wells during a course of 33–50 days, demonstrating differences in the timing of pigmentation at different seeding densities. The greatest yield was typically achieved at a seeding density of 35,000 cells per cm2. (B): Immunocytochemistry for OTX2 in wells seeded at 17,000 hESCs per cm2 and 100,000 cells per cm2. In the very high density wells, the OTX2 positive pigmented areas are spread out. In contrast, low density wells appear as discrete OTX2 positive pigmented foci. Scale bars = 500 µm and 100 µm, inset. (C): Bar graph showing the average fold change in the percentage of pigmented surface area at day 50 across a range of hESC seeding densities over several passages (n = 4–6; ∗, p < .05). (D): qPCR showing the normalized expression of RPE markers at day 50 in the differentiating wells shown in (A). Data show the average normalized expression in triplicate reactions relative to the lowest seeding density (17,000 cells per cm2). Abbreviations: BEST, bestrophin; BF, bright field; DAPI, 4′,6-diamidino-2-phenylindole; hESCs, human embryonic stem cells; qPCR, quantitative polymerase chain reaction.

