
FIGURE 6.
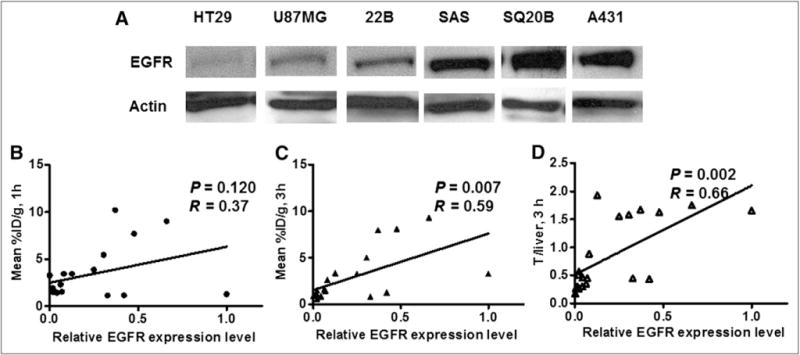
(A) Western blot quantification of EGFR expression at various tumor xenograft models. Correlation of PET quantification of tumor uptake at 1 h after injection (B) or 3 h after injection (C), or tumor-to-liver uptake ratio at 3 h after injection (D) with normalized EGFR expression level (n = 19).