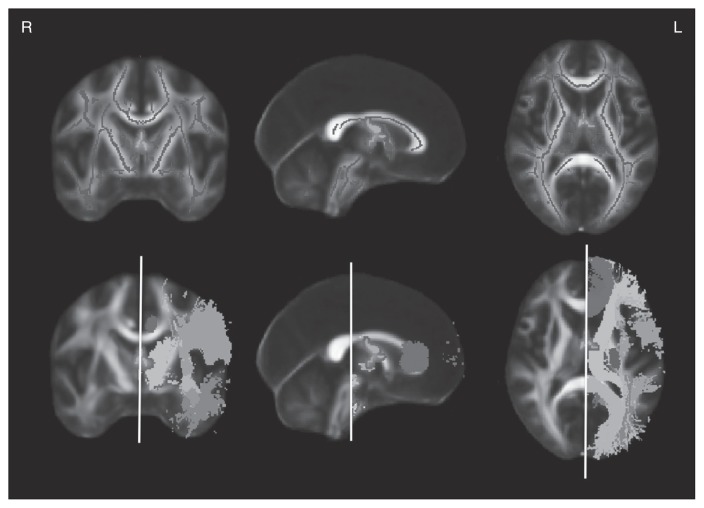
Fig. 2.
Map of the mean diffusivity (MD) differences between groups (patients > controls). The FMRIB58_FA (1 mm thick) template provided in FSL was used in all the figures. Top row: results are shown on top of the mean FA skeleton template created from all the participants’ images for this study. Bottom row: results are shown on top of the atlas of tracts probability Johns Hopkins University–International Consortium for Brain Mapping (threshold 0 and 1 mm thick) provided in FSL; shades correspond to specific probability tracts in the left hemisphere: superior longitudinal tract, corticospinal tract, cingulum, anterior thalamic radiation, splenium of the corpus callosum, inferior longitudinal tract and inferior fronto-occipital tract. L = left; R = right.

