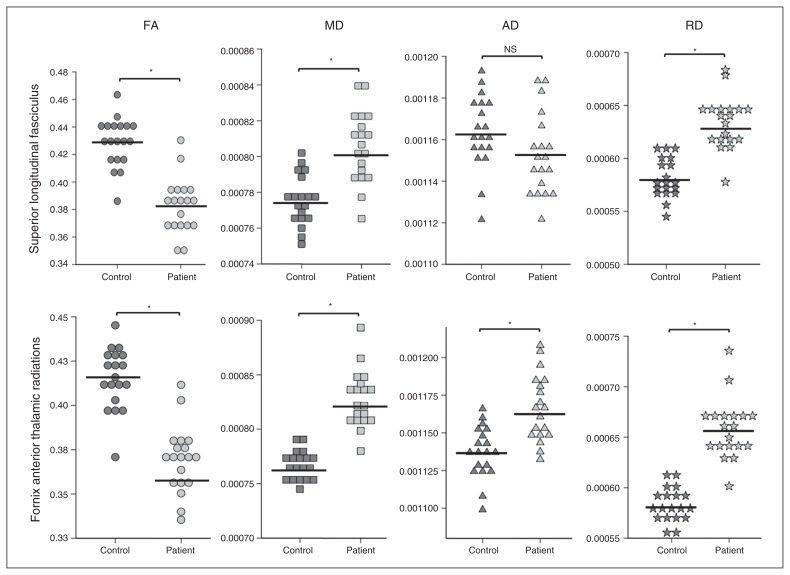
Fig. 3.
Diffusivity measures’ eigenvalues for patients and controls in the 2 regions with significant differences in fractional anisotropy (FA) and mean diffusivity (MD). Black horizontal lines represent the mean of the values represented in each plot. *Significant between-group differences of the extracted measures, all p < 0.001. AD = axial diffusivity; NS = nonsignificant comparison; RD = radial diffusivity. *p < 0.05.

