
Extended Data Figure 7. Apcin and proTAME synergize to block mitotic exit in human cells, as measured in a fixed cell assay.
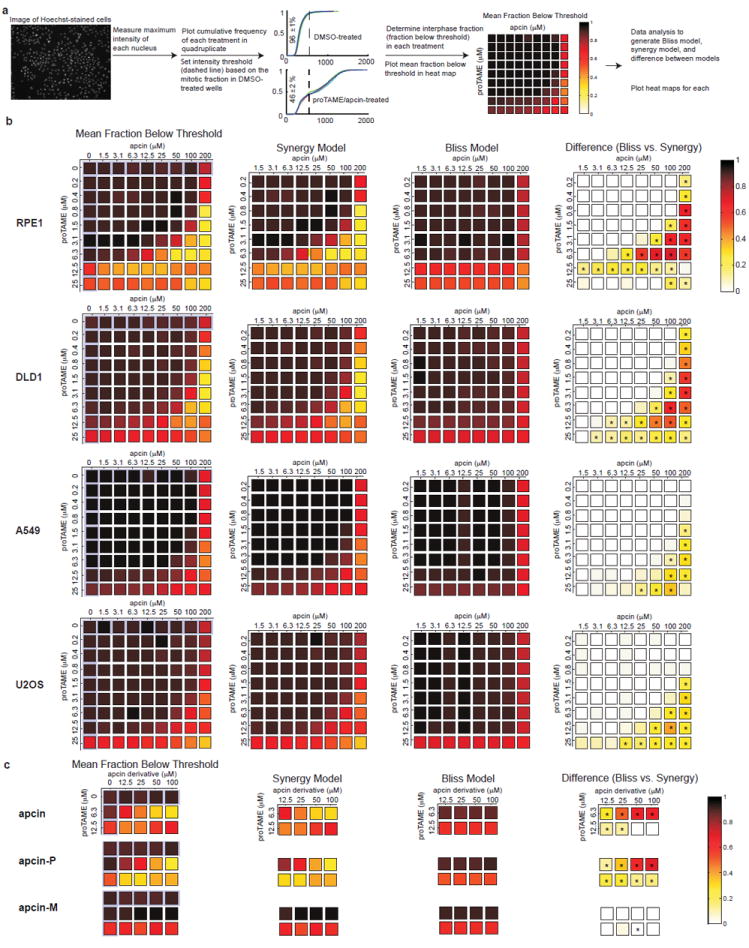
a, Summary of the fixed-cell imaging assay and data processing methods to determine synergy between apcin and proTAME. See methods for detailed description of the assay. b, First column: Primary data plotted as a heat map displaying mean fraction below threshold for each drug treatment concentration in each of four cell lines. This threshold is established based on the mitotic index of DMSO-treated cells. Note that a high value in this column indicates a low mitotic index. Effects of single drugs alone are highlighted in pale purple. Second column (labeled “Synergy Model”): Calculated effect of the combination of drugs based on a model that permits synergistic interaction between proTAME and apcin. Because this panel shows calculated values of combination effects, the effects of individual drugs are not shown. Note that the synergy model closely parallels the actual data shown in the first column. Third column: Calculated effect of the combination of drugs based on a model that permits only multiplicative interaction between proTAME and apcin (Bliss Model). Because this panel shows calculated values of combination effects, the effects of individual drugs are not shown. Note that the Bliss model does not closely parallel the actual data shown in the first column. Fourth column: Heat map of the difference between the Synergy and Bliss model predictions shows the degree of synergy at each drug dose combination (same as Fig. 4a for RPE1 cells). Asterisk indicates P<0.05 for analysis of four technical replicates. See Supplementary Information for details of the statistical analysis. c, Activity of apcin derivatives in the fixed cell assay described in a, using RPE1 cells.