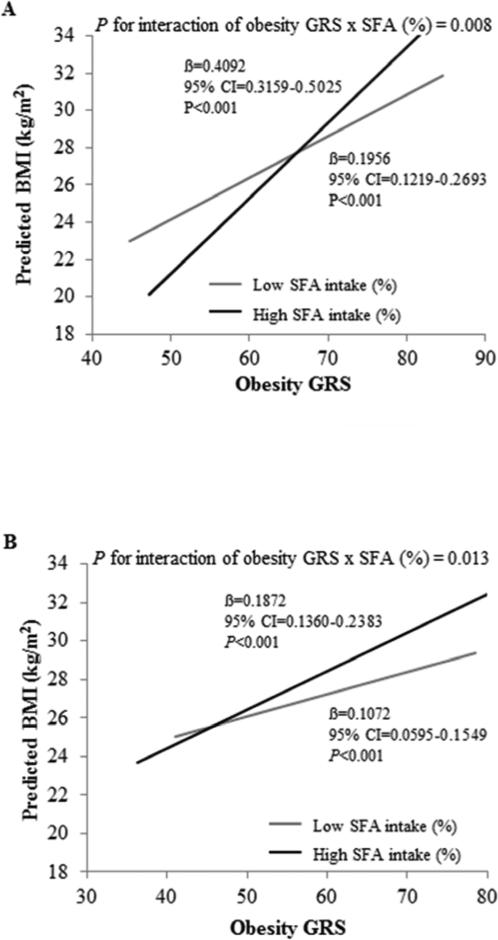
Figure 1.
Interaction between the obesity GRS and SFA intake (% total daily energy intake) for BMI. (A) Interaction between the obesity GRS and SFA intake (% total daily energy intake) for BMI in GOLDN. Predicted values of BMI and waist circumference by the obesity GRS are shown according to SFA intake (as a dichotomous variable). Predicted values were calculated from the regression models that contain SFA intake (as a categorical variable, 2 levels based on the population median (interquartile range): 11.82 (9.96-13.51), the obesity GRS (as continuous), their interaction term, and the potential confounders including familial relationships, gender, age, center, tobacco smoking (current vs. former/never), alcohol consumption (current vs. former/never), hyperlipidemia medication use, presence of diabetes, physical activity and total energy intake (in both studies). P-value for interaction indicates the statistical significance of the interaction term for SFA intake and the obesity GRS in the adjusted regression model. P-values for low and high SFA intake models indicate the statistical significance of the regression coefficients for the obesity GRS in the adjusted regression model. (B) Interaction between the obesity GRS and SFA intake (% total daily energy intake) for BMI in MESA. Predicted values of BMI by the obesity GRS are shown according to SFA intake (as a dichotomous variable). Predicted values were calculated from the regression models that contain SFA intake (as a categorical variable, 2 levels based on the population median (interquartile range): 10.68 (8.34-13.01), the obesity GRS (as continuous), their interaction term, and the potential confounders including population structure, gender, age, center, tobacco smoking (current vs. former/never), alcohol consumption (current vs. former/never), hyperlipidemia medication use, presence of diabetes, physical activity and total energy intake (in both studies). P-value for interaction indicates the statistical significance of the interaction term for SFA intake and the obesity GRS in the adjusted regression model. P-values for the low and high SFA intake models indicate the statistical significance of the regression coefficients for the obesity GRS in the adjusted regression model. BMI, body mass index; GRS, genetic risk score; SFA, saturated fatty acid.

