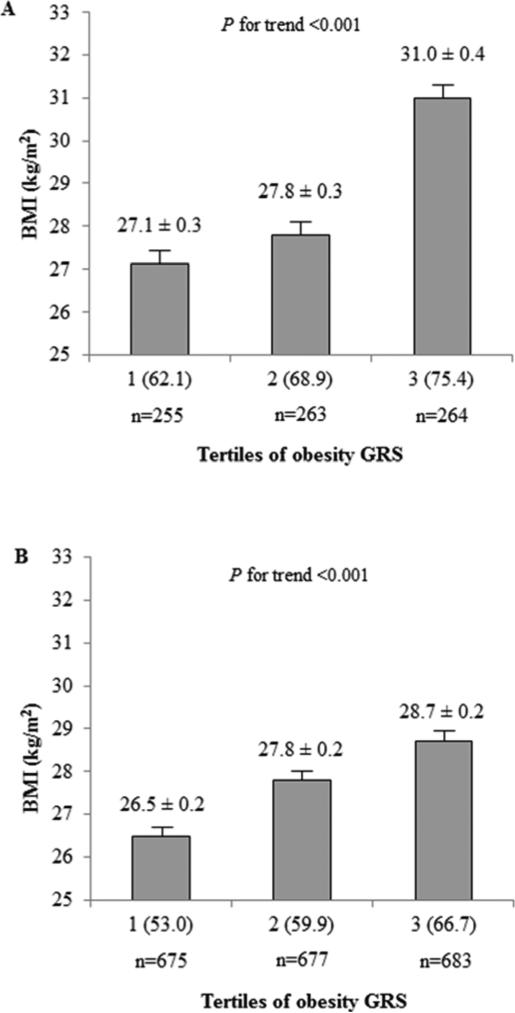
Figure 2.
Relationship between the obesity GRS and BMI. (A) BMI by tertiles of obesity GRS in GOLDN. Ranges (minimum-maximum) for tertiles 1 through 3 are 44.8-66.3, 66.4-71.5 and 71.6-85.7, and values in parentheses are means of tertiles of obesity GRS. P for trend was calculated by the generalized estimating equation approach with exchangeable correlation structure implemented in the SAS GENMOD procedure to adjust for familial relationships, gender, age and center. (B) BMI by tertiles of obesity GRS in MESA. Ranges (minimum-maximum) for tertiles 1 through 3 are 37.6-56.3, 56.4-62.2 and 62.3-83.1, and values in parentheses are means of tertiles of obesity GRS. P for trend was calculated by using a general linear regression model adjusted by population structure, gender, age and center. BMI, body mass index; GRS, genetic risk score; SFA, saturated fatty acid.

