
Extended Data Figure 3. Visualization of ΦNM1 transcription profiles 6, 15, 30, and 45 min post infection (MOI 20).
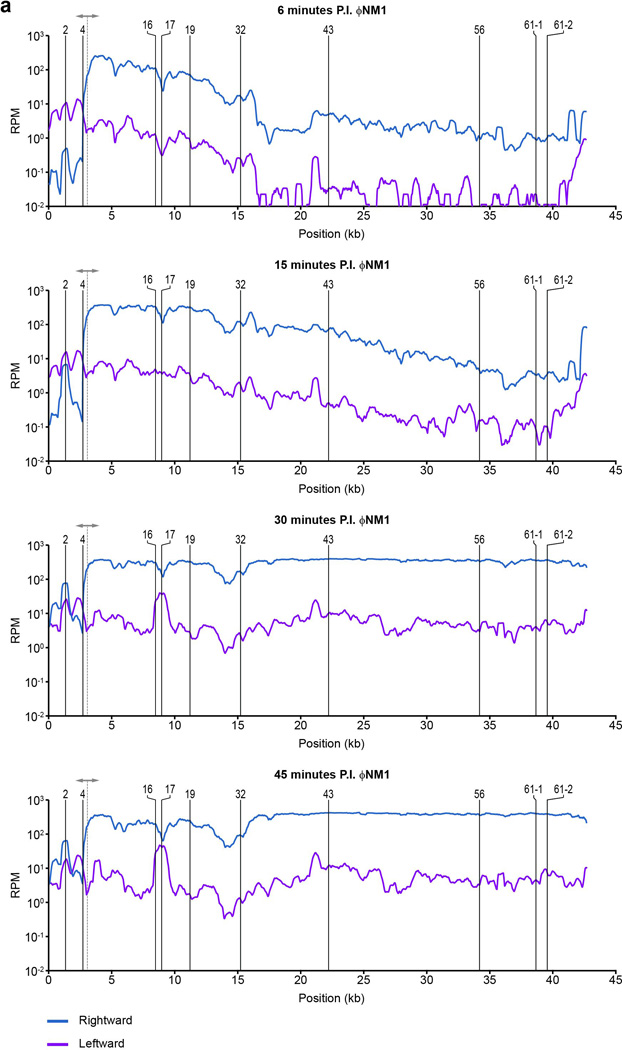
Rightward and leftward expression values are plotted as blue and fuchsia lines, respectively, in reads per million (RPM). Position of relevant spacer targets are indicated with vertical solid lines. The dotted line with arrowheads marks the position of the central promoter. To improve readability, all curves were smoothened by plotting the average RPM values over a 500 bp sliding-window. To the left of the central promoter, rightward expression is comparable to leftward expression by 30 min post infection, consistent with the strand-independent targeting observed for this region.