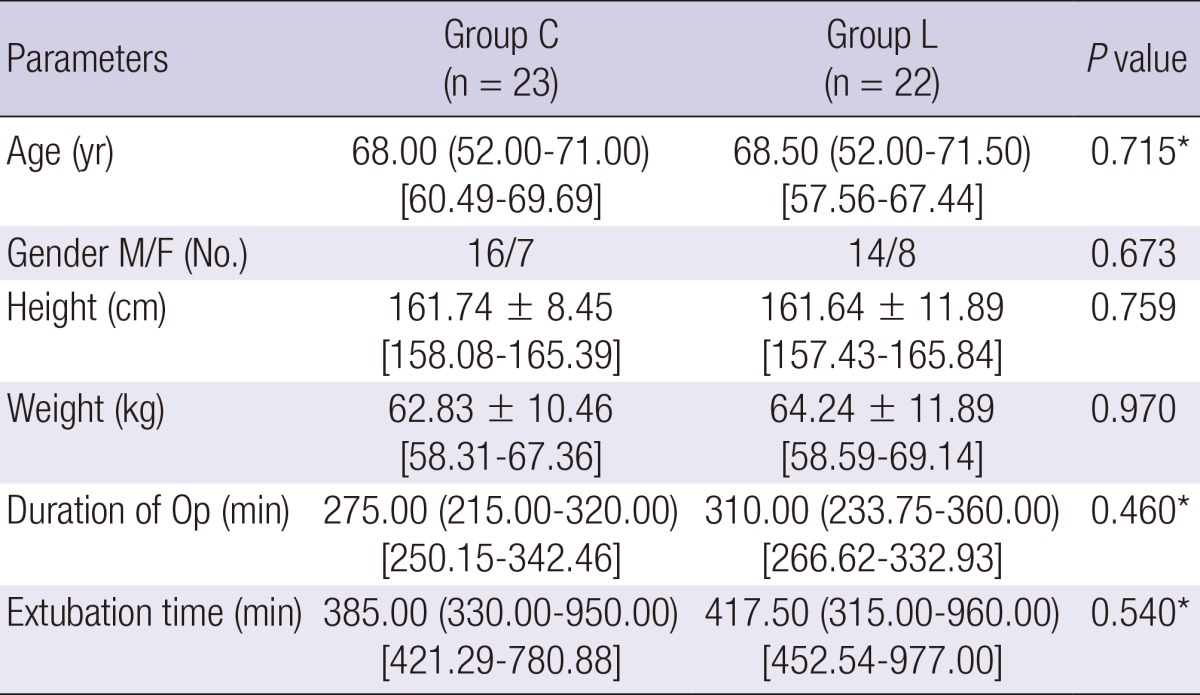
Table 1.
Demographic data by group

Values are expressed as mean±SD [95% confidence interval], median (interquartile range) [95% confidence interval] or absolute number. *Mann-Whitney U test is used and expressed as median (interquartile range) [95% confidence interval] because of abnormal distribution. M, male; F, female; Op, operation.
