
Figure 1.
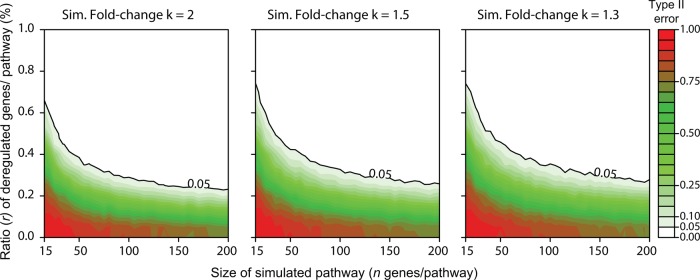
Synthetic data: evaluation of the size and ratio of concordant deregulated genes within a pathway required to be found deregulated in the N-of-1-pathways statistical analysis component. Each point represents one size of a simulated pathway generated by randomly selecting n genes and a ratio r of the deregulated genes within the pathway. The ratio r is artificially increased by a k-fold change in a simulated pathway seeded in the exploration dataset (k∈{1.3, 1.5, 2}). We then applied the N-of-1-pathways statistical analysis component to verify if the simulated pathway was found deregulated with a significance threshold (type I error) chosen as an unadjusted p value of ≤0.05. For each value (n, r, k), we repeated this procedure 1000 times in order to estimate the false negative rate (type II error β). Sim., simulated (see the ‘Theoretical results: validation using synthetic data’ section in the Methods).