
Figure 3.
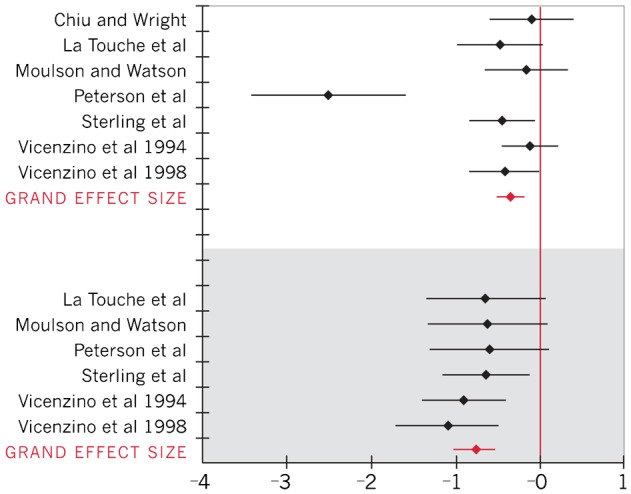
Forest plot of effect sizes for skin temperature (negative effect sizes represent a decrease in skin temperature; within-group effect sizes represented in white; between-group effect sizes represented in gray)
Official websites use .gov
A
.gov website belongs to an official
government organization in the United States.
Secure .gov websites use HTTPS
A lock (
) or https:// means you've safely
connected to the .gov website. Share sensitive
information only on official, secure websites.
Forest plot of effect sizes for skin temperature (negative effect sizes represent a decrease in skin temperature; within-group effect sizes represented in white; between-group effect sizes represented in gray)