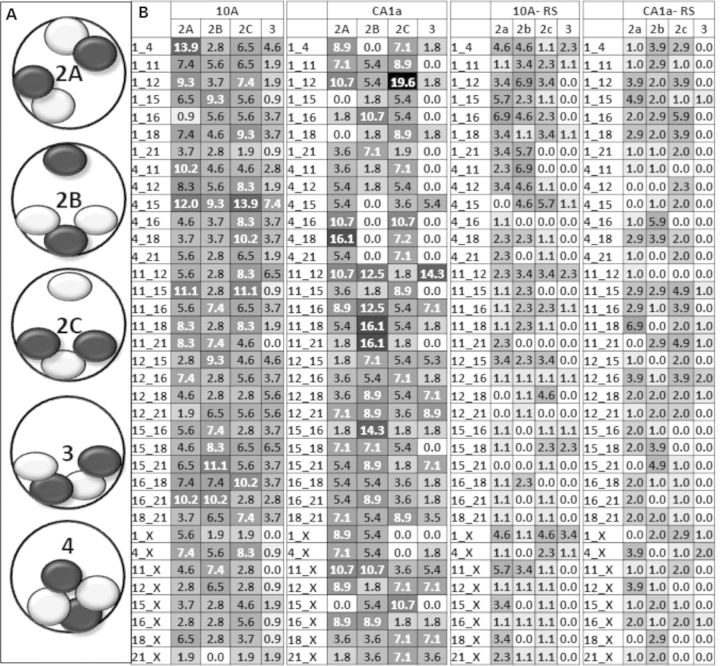
Figure 6.
Patterns of multiple interactions of CT pairs. (A) Categories of multiple interactions of CT pairs for 2, 3 and 4 interactions are illustrated; (B) the percent of total cells that have type 2a, 2b and 3 interactions were calculated and are shown for 10A, CA1a, and their corresponding random simulations (RS). Type 4 interactions were extremely rare (0–2%) and are not shown. Values are shaded in grayscale from white (low) to black (high) levels, gray are intermediate values. The top 15% of values are written in white type. None of the random simulations values were in the top 15%.

