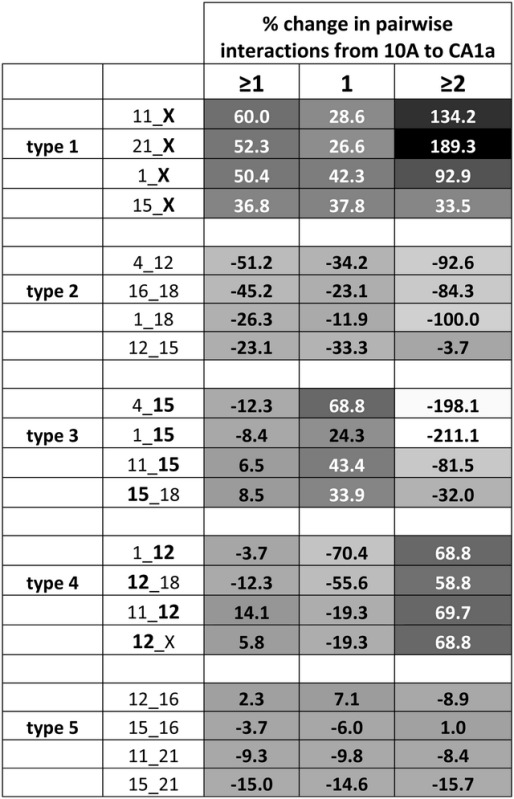
Table 1.
Five types of changes in CT interaction profiles
 |
Calculation of the percent difference in the level of interaction between pairwise CT reveals five types of altered CT interaction. Type 1 alterations demonstrate an overall increase in interaction, whereas type 2 have an overall decrease in interaction. Type 3 switches from having greater levels with a singular interaction to those with more nuclei with multiple interactions. Type 4 switch from having more nuclei with multiple interactions to more with singular interactions. Type 5 do not change significantly in interaction. The top 4 pairwise CT interactions from each type are presented. Values are shaded in grayscale from low (white) to high (black). The top third of values are written in white.
