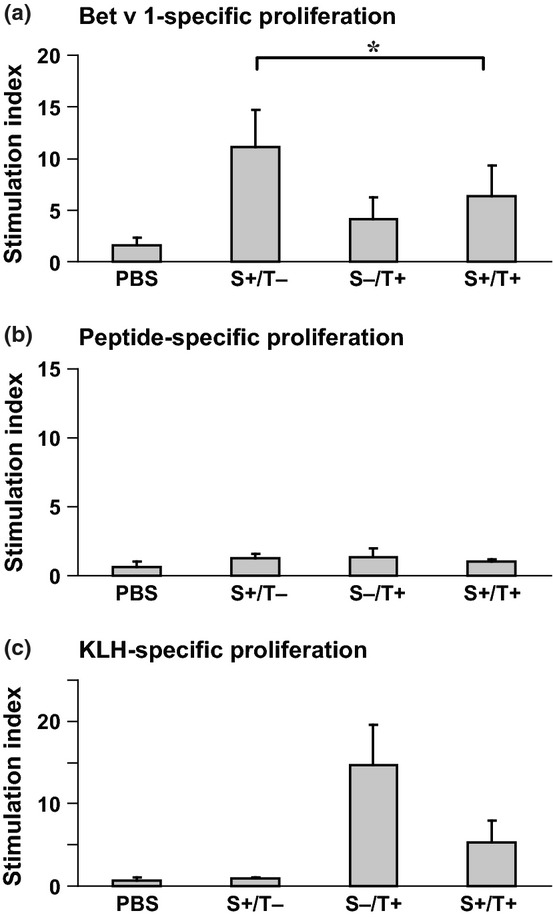
Figure 6.

T cell responses of mice from the therapeutic scheme. Bet v 1- (a), peptide- (b), and KLH-specific (c) proliferations of splenocytes from mice of the therapeutic scheme (Fig.2) are displayed (y-axes: stimulation indices SI ± SD). Statistically significant differences are indicated (*P < 0.05). S: sensitization, T: therapy.
