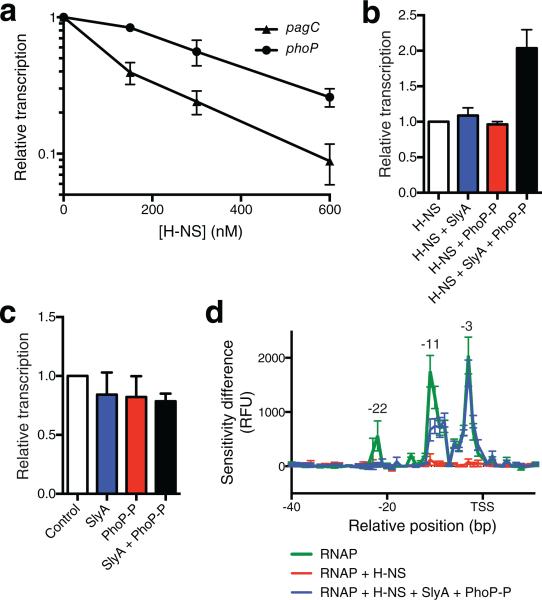
Figure 3. Reconstitution of the pagC counter-silencing circuit in vitro.
(a) H-NS strongly represses pagC in vitro. Transcriptional outputs are normalized to the 0 nM control reaction. (b) Reconstitution of pagC counter-silencing in vitro. A pagC-containing template was incubated in the presence of 600 nM H-NS, 100 nM SlyA, and 500 nM PhoP-P, as indicated. Transcriptional output is normalized to the H-NS reaction. Both SlyA and PhoP-P are required for counter-silencing. (c) SlyA and PhoP-P do not act as co-activators in the absence H-NS. A pagC-containing template was incubated in the presence of 100 nM SlyA, 500 nM PhoP-P (Fig. 2), or both as indicated. Transcriptional output is normalized the control reaction. Data represent the mean ± SEM; n = 3. (d) KMnO4 footprinting analysis indicates that RNAP is unable to form an open complex in the presence of H-NS. The addition of SlyA and PhoP-P restores open complex formation at the pagC promoter. Results are presented as a DDFA plot representing difference in peak height in relative fluorescent units (RFU) between the control (no RNAP) and the experimental samples. Peaks indicate regions of single stranded DNA caused by open complex formation. The relative distance to the transcriptional start site (TSS) is indicated on the horizontal axis. Data represent the mean ± SD; n=3. See also Supplementary Fig. 3 and Supplementary Fig. 4.

