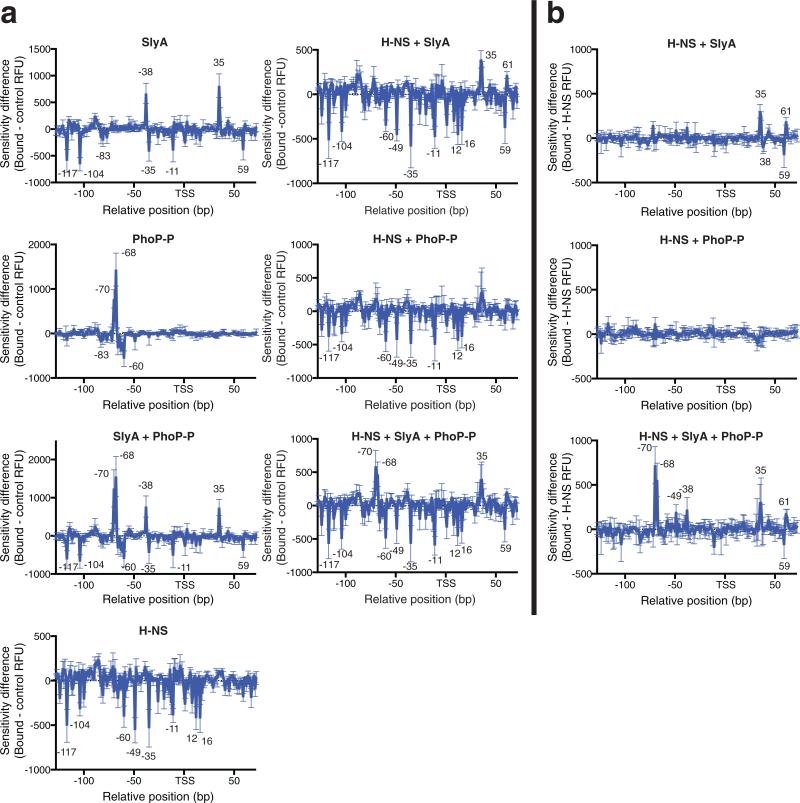
Figure 4. DNase I DDFA of the pagC promoter region.
In vitro DNase I footprinting studies were performed on the pagC promoter region with H-NS, SlyA, and PhoP-P, at concentrations of 600 nM, 100 nM, and 500 nM respectively, as indicated. DNA-protein complexes were incubated at room temperature before digestion with DNase I. Results are presented as DDFA plots, representing the difference in fluorescent peak height (RFU) between the protein-free control and the experimental sample (a). DDFA plots are also shown for the H-NS + SlyA, H NS + PhoP-P, and the H-NS + SlyA + PhoP-P reactions, representing the difference between the H-NS control and the experimental sample (b). The relative distance in base pairs to the TSS is indicated on the horizontal axis. Peaks indicate regions of hypersensitivity, typical of bent or distorted DNA, whereas valleys indicate protected regions, typical of protein binding sites. Approximate sizes of peaks of note are indicated. Data represent the mean ± SD; n = 3. See Supplementary Fig. 5 for representative raw chromatograms.

