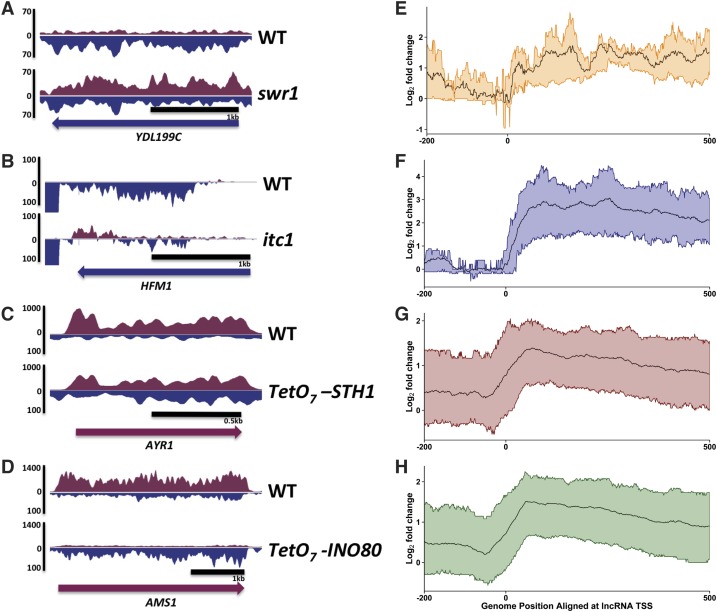
Figure 3.
Chromatin remodeling factors repress ASlncRNAs. (A–D) Representative strand-specific RNA-seq data in Δswr1 (A), Δitc1 (B), tet-STH1 (C), and tet-INO80 (D) mutants. Blue and purple signals denote Watson and Crick strand transcripts, respectively. The direction of the coding gene transcription is shown at the bottom of each panel. (E–H) ASlncRNA meta analyses. The ratio of ASlncRNA levels in in Δswr1 (E), Δitc1 (F), tet-STH1 (G), and tet-INO80 (H) mutants relative to wild-type cell levels is shown in log2 scale. The black lines represent the average signals, and the colored lines represent the RNA signals of the top 25% and bottom 25% changes in the mutants.

