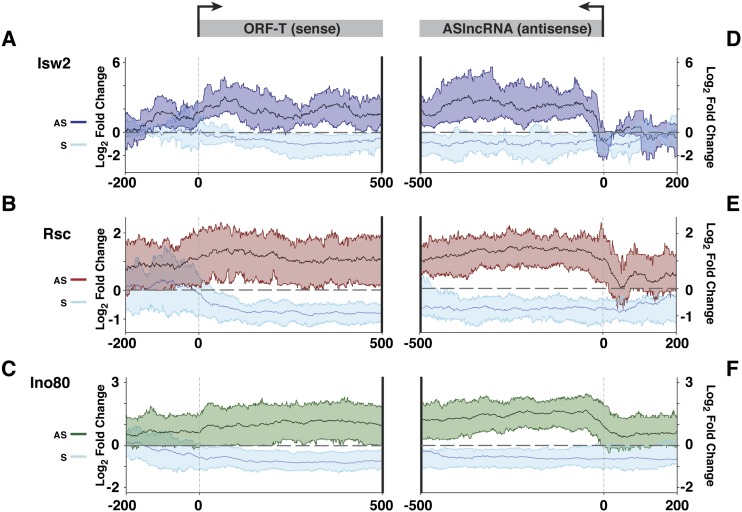
Figure 6.
Identification of ASlncRNAs whose repression by chromatin remodeling factors is required for the maintenance of the normal level of overlapping mRNAs. (A) Changes in the levels of Isw2-repressed CRRATs (dark blue) and overlapping mRNAs (light blue) in itc1 cells. The solid lines denote the mean, and the colored ribbon shows the RNA signals of the top 25% and bottom 25% values in the mutants. RNAs are aligned at the TSSs of mRNAs (left panel) and the TSSs of CRRATs (right panel). The Y-axis is in log2 scale, and a dotted line is at the value 0. (B) Changes in the levels of Rsc-repressed CRRATs (red) and overlapping mRNAs (light blue) in tet-STH1 cells. The solid lines denote the mean, and the colored ribbon shows the RNA signals of the top 25% and bottom 25% values in the mutants. RNAs are aligned at the TSSs of mRNAs (left panel) and the TSSs of CRRATs (right panel). The Y-axis is in log2 scale, and a dotted line is at the value 0. (C) Changes in the levels of Ino80-repressed CRRATs (green) and overlapping mRNAs (light blue) in tet-INO80 cells. The solid lines denote the mean, and the colored ribbon shows the RNA signals of the top 25% and bottom 25% values in the mutants. RNAs are aligned at the TSSs of mRNAs (left panel) and the TSSs of CRRATs (right panel). The Y-axis is in log2 scale, and a dotted line is at the value 0.

