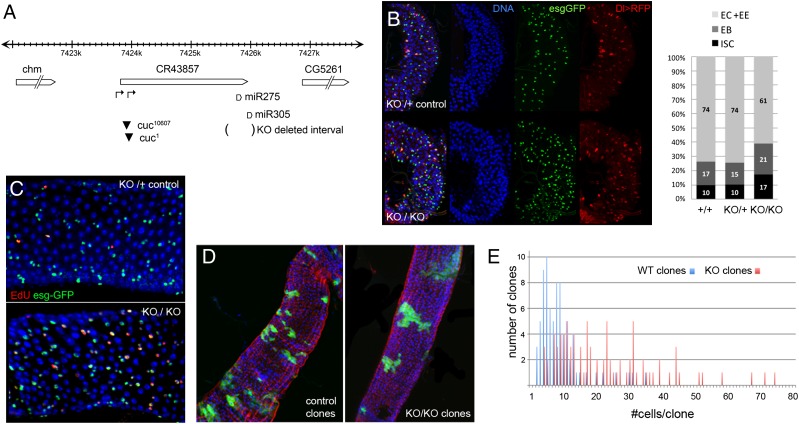
Figure 2.
The miR-275/miR-305 cluster controls ISC proliferation. (A) miR-275 and miR-305 miRNAs are located near the 3′ end of the noncoding transcript CR43857 in the interval between the protein-coding genes chm and CG5261. All three genes are transcribed in the same orientation. Black triangles indicate P-element insertion sites. Arrows indicate predicted transcription start sites. The interval deleted in the KO allele is indicated by parentheses. The genomic region containing the miRNAs was replaced by a mini-white cassette flanked by LoxP sites (details are in Supplemental Fig. S1A). miR-275 and miR-305 miRNAs were reduced to low levels in animals carrying the P-element insertion alleles cuc1 and cuc10607 in trans to the KO allele (Supplemental Fig. S1B). The cuc P-element insertions appear to be alleles of miR-275–305. Expression of CG5261 was unaffected in the miR-275–305 deletion mutant, monitored by quantitative RT–PCR (qRT–PCR). (B) Posterior midguts were collected from 7-d-old adults and labeled to visualize ISCs (Dl-Gal4>UAS-RFP; red). esg-GFP labels both ISCs and EB cells (green). Nuclei were labeled with DAPI (blue). (Top panel) KO/+ control. (Bottom panel) KO/KO mutant. (Histogram) Dl-positive and esg-positive cells were counted from seven midgut samples of each genotype, represented as average percent of total cells. ANOVA: P = 0.008 comparing the number of Dl-Gal4 cells in KO/KO versus control; P = 0.024 comparing esg-Gal4 cells in KO/KO versus control. Persistence of Dl-Gal4-driven RFP expression might lead us to underestimate the proportion of esg-GFP-positive cells that are EBs but would not affect the comparison between genotypes. (C) EdU incorporation in KO/+ control and KO/KO mutant midguts. esg-Gal4 was used to label ISCs and EB cells (green). Anti-EdU (red) labels cells that underwent DNA synthesis during the 30-min exposure to EdU. (D,E) MARCM clones in the midgut labeled with GFP. (D, left) Control clones. (Right) KO/KO mutant clones. (E) Mutant clones contained more cells on average.

