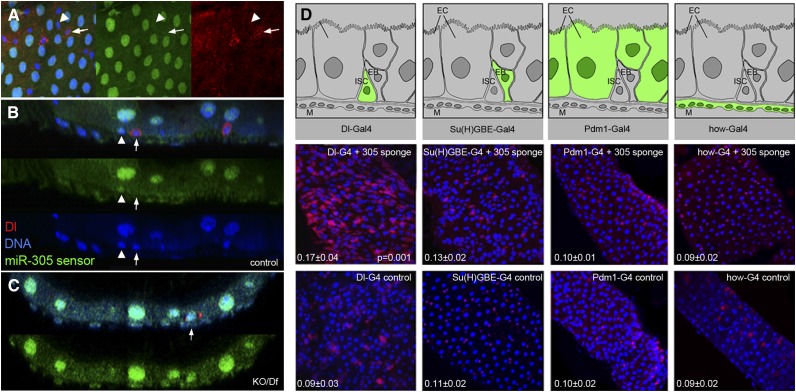
Figure 4.
miR-305 acts in ISCs. (A–C) Images of posterior midguts expressing a miR-305 sensor transgene (green). Samples were labeled with anti-Dl to visualize ISCs (red) and with DAPI (blue). (A) Normal control, surface view. ISCs and EB cells are diploid and have small nuclei. (Arrows) A Dl-expressing ISC; (arrowheads) adjacent EBs. miR-305 sensor GFP levels were lower in the nuclei of the small cells. This difference disappeared in the miR-305 mutant background (Supplemental Fig. S2). (B) Optical cross-section showing an adjacent pair of basally located ISCs and EB cells. miR-305 sensor GFP levels were similar to background GFP levels in the ISCs but were detectable above background in the EB cell. (C) miR-305 sensor GFP levels in a 5-d-old KO/Df mutant midgut. The arrowhead indicates a Dl-expressing ISC. The level of GFP expression is comparable in the ISCs and other cells in the miR-275–305 KO/Df mutant combination. Note the dysplastic appearance of the gut, with mispositioning of the normally basally located ISCs and evidence of Dl expression in partially differentiated cells (partially endoreplicated), features that are more typically found in older flies (see also Supplemental Fig. S2). (D, top row) Summary of the cell type specificity of the Gal4 drivers. (Middle row) Gal4-driven expression of the UAS-miR-305 sponge transgene to selectively deplete miR-305 in ISCs and EB, EC, and EB cells. ISCs were labeled with anti-Dl (red). (Bottom row) Gal4 driver controls without the UAS-miR-305 sponge. The ratio of Dl+/total cells is shown in the bottom left corner for each genotype (average ± standard deviation [SD] from counts of eight midguts). The difference between miR-305 sponge-expressing and control was significant for Dl-Gal4 (P = 0.0011, Mann Whitney test). The differences were not significant with the other Gal4 drivers (see Supplemental Fig. S3).

