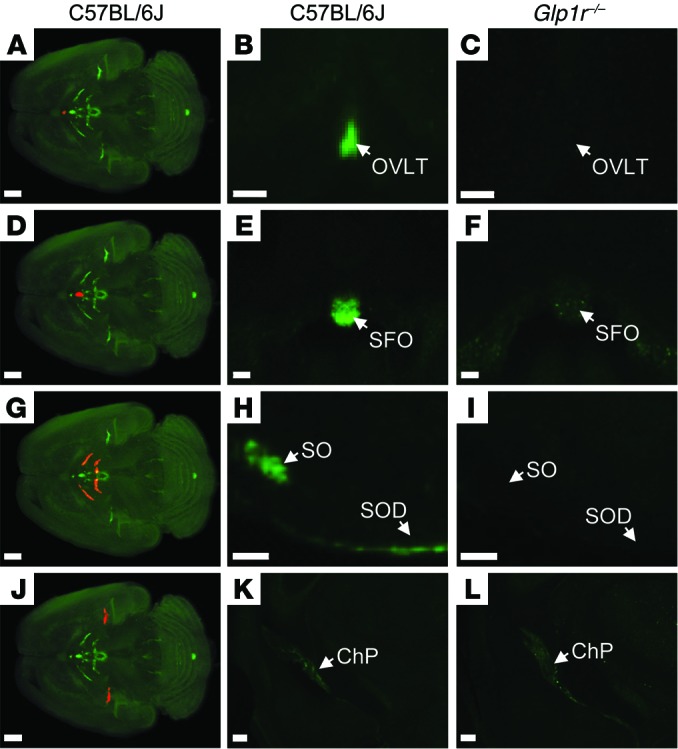
Figure 4. Distribution of fluorescently labeled liraglutide in the mouse brain.

The brain tissue was scanned at 620 nm and 710 nm, representing both autofluorescence from the tissue (gray) and specific signal (green). The red regions in A, D, G, and J are shown at higher magnification in B, E, H and K, respectively (unspecific staining has been removed as described in Supplemental Figure 2). Images in the middle and right columns represent enlargements of a single section from (B, E, H, and K) C57BL/6J or (C, F, I, and L) Glp1r–/– mice administered with liraglutide750. Liraglutide750 was detectable in (A and B) organum vasculosum of the lamina terminalis, (D and E) subfornical organ, (G and H) supraoptic nucleus and supraoptic decussation, and (J and K) ChP. (C, F, I, and L) In mice lacking a functional GLP-1R, no liraglutide750 signal could be detected in any of these regions except from ChP. Scale bars: 200 μm (A, D, G, and J–L); 100 μm (B, C, E, F, H, and I). OVLT, organum vasculosum of lamina terminalis; SFO, subfornical organ; SO, supraoptic nucleus; SOD, supraoptic decussation.
