
FIGURE 3.
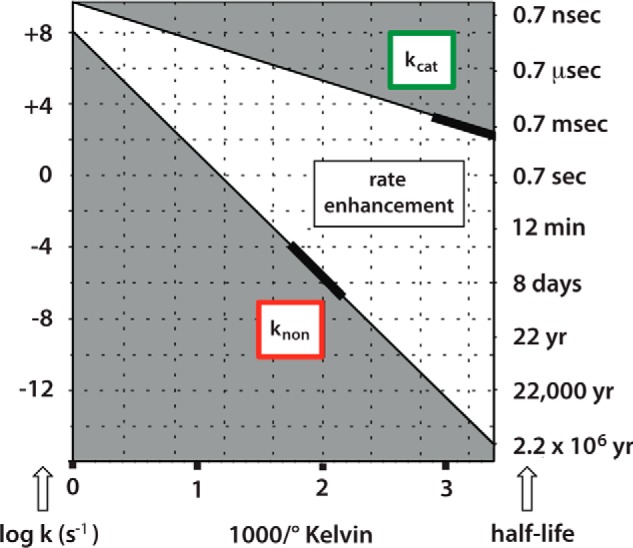
Arrhenius plots for the enzymatic and nonenzymatic α-glucosidase reactions. The bold segments of the line show the temperature range over which rate measurements were conducted (11).
Official websites use .gov
A
.gov website belongs to an official
government organization in the United States.
Secure .gov websites use HTTPS
A lock (
) or https:// means you've safely
connected to the .gov website. Share sensitive
information only on official, secure websites.
Arrhenius plots for the enzymatic and nonenzymatic α-glucosidase reactions. The bold segments of the line show the temperature range over which rate measurements were conducted (11).