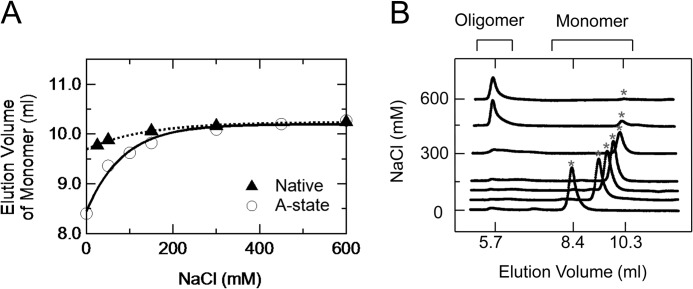
FIGURE 5.
Size exclusion chromatography of native state and A-state with varying NaCl concentrations. A, elution volumes of native state at pH 4.6 (filled triangles) and the A-state at pH 2.0 (empty circles) as functions of the NaCl concentration. The elution volume as a function of NaCl was fitted to an exponential function, y0 + A × exp(invTau × [NaCl], where y0, A, and invTau are 1.0 ± 0.1 × 101, −5.4 ± 1.4 × 10⁻¹, and 7.4 ± 0.6 × 10⁻³, respectively, for the native state and 1.0 ± 0.2 × 101, −1.8 ± 0.3 × 100, and 1.2 ± 0.5 × 10⁻³ for the A-state. B, elution profiles of the A-state at pH 2.0 with different NaCl concentrations. The gray asterisks represent the elution peaks of the A-state. The peak around ∼5.7 ml represents the elution of the β-rich oligomer irreversibly transformed from the A-state (see also Fig. 7B).

