
FIGURE 6.
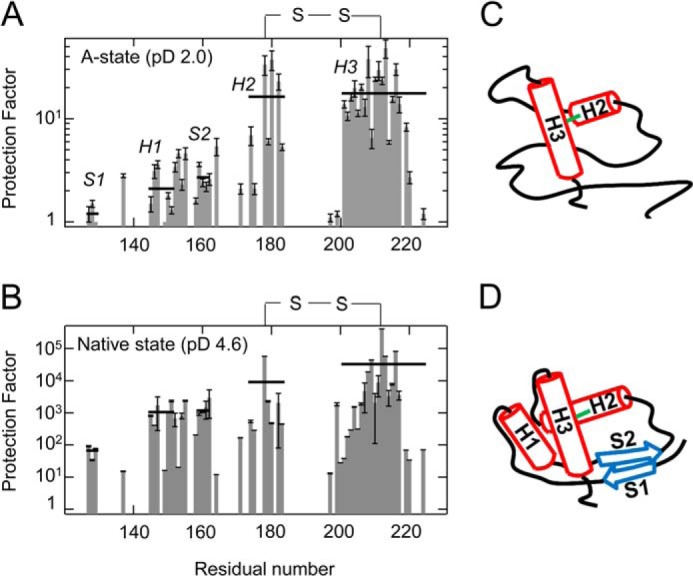
A and B, protection factors of the A-state at pD 2.0 (A) and native state at pD 4.6 (B). The solid horizontal lines represent the average protection factor within each secondary structure (S1, H1, S2, N-terminal H2, and H3). See also Table 1. C, schematic structure of the A-state, where the H2-H3 region forms a relatively stable folded structure (red solid rods), whereas the S1-H1-S2 region is highly unstable (black line). D, schematic structure of the native state based on the three-dimensional structure of PrPC (Protein Data Bank entry 1AG2). H1, H2, and H3 are shown as red solid rods, and the antiparallel β-strands are shown as blue arrows. Error bars, S.D.