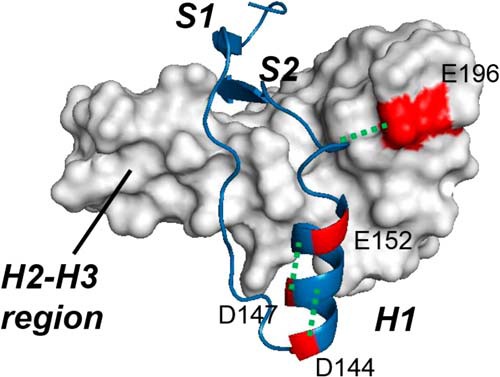
FIGURE 9.

Charged residues whose protonations may trigger A-state formation. The charged residues with pKa values of 2.5 ± 1.0 are shown in red in the three-dimensional structure of native PrPC (Protein Data Bank entry 1AG2) (Asp144, Asp147, Glu152, and Glu196). The salt bridges between these residues and neighboring residues are represented as green dotted lines (Asp144–Arg148, Asp147–Arg151, and Arg158–Glu196). The S1-H1-S2 region is shown as a blue ribbon diagram, whereas the H2-H3 region is shown as a white surface diagram.
