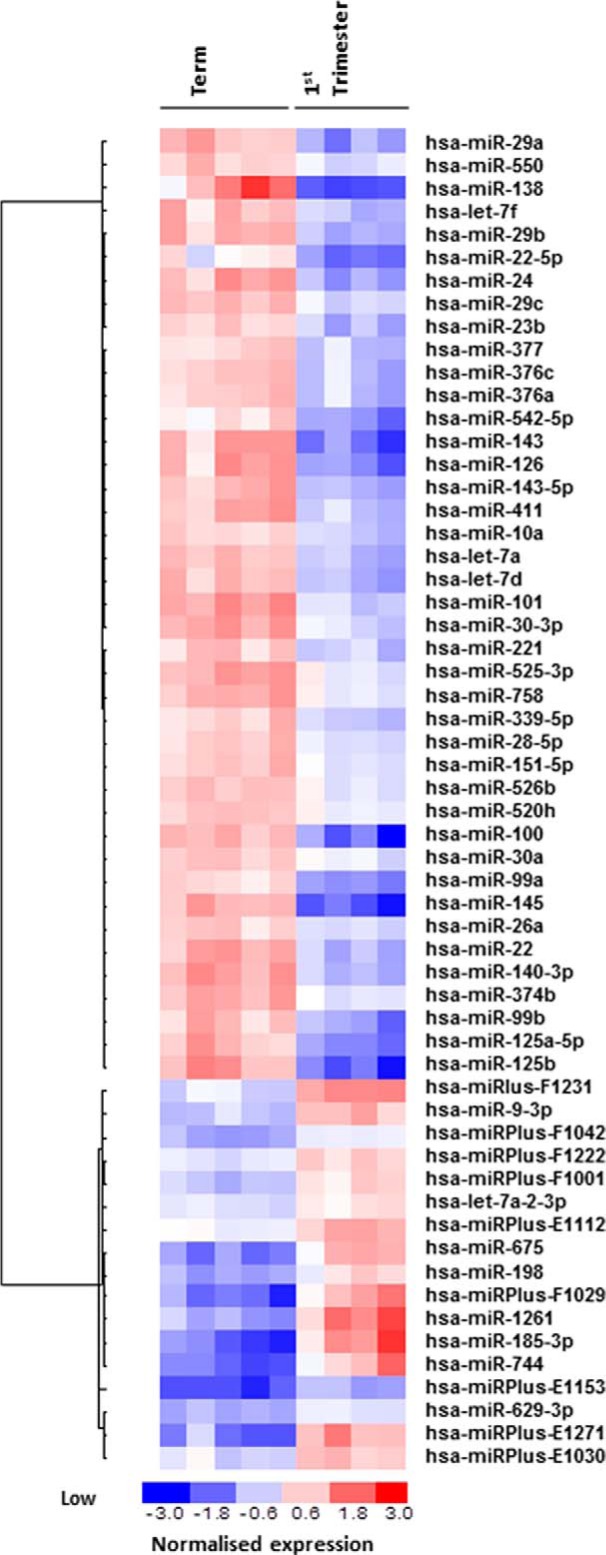
FIGURE 1.

Differential expression of miRs between first trimester and term human placental tissue. Total RNA was isolated from fresh first trimester (n = 5) and term (n = 5) human placental tissue and applied to a miRCURYTM LNA array (version 11.0 hsa; Exiqon). The heat map diagram shows the result of the two-way hierarchical clustering of miRs and samples. Each row represents a miR, and each column represents a sample. The color scale shown at the bottom illustrates the relative expression level of a miR across all samples; red represents an expression level above the mean, and blue represents expression lower than the mean. The analysis was performed on log2(Hy3/Hy5) signal intensity ratios (where Hy3 represents the sample and Hy5 represents the pool control consisting of equal aliquots of RNA from each sample) that passed the filtering criteria on variation across samples; p < 0.005. miRPlus sequences are licensed (Exiqon) human sequences not yet annotated in miRBase.
