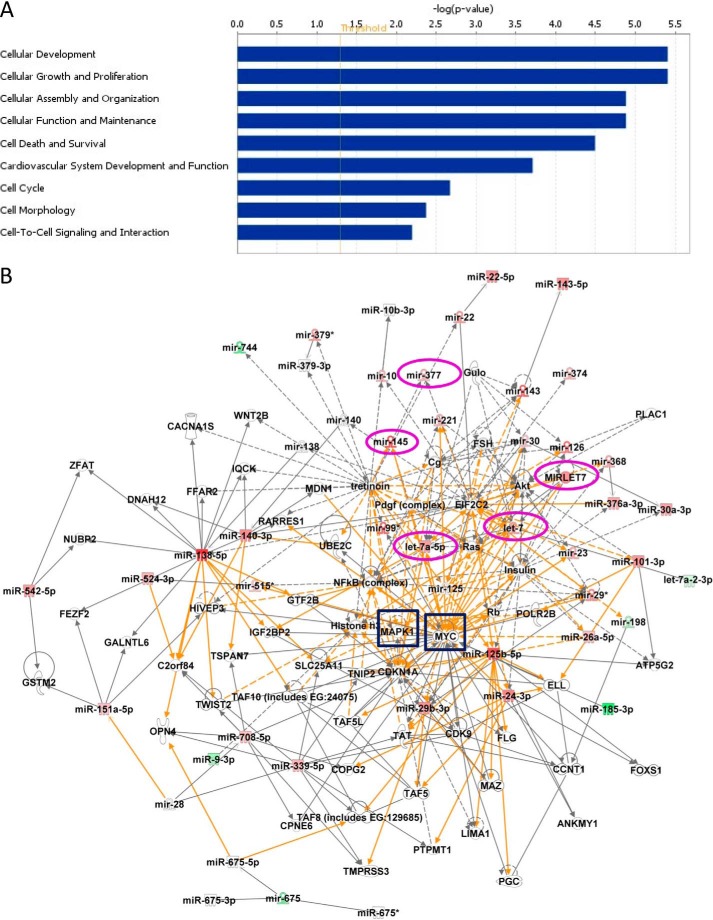
FIGURE 3.
Functional classifications and network generation of altered miRs and their potential targets. A, the data set containing the altered miRs obtained from miRCURYTM LNA array was uploaded into IPA software, and the altered miRs were classified into significantly enriched biological functions. y axis values represent an IPA network score (equal to the −log(p value), where a score of 1.3 (the threshold value; red line) is equivalent to p = 0.05) to indicate the probability that the miRs fall within these biological classifications; only cellular functions exceeding the threshold value were included. A right-tailed Fisher's exact test was used to determine the probability that each biological function identified is due to chance alone. B, networks of known (solid lines) and inferred (dashed lines) interacting molecules were created based on data within Ingenuity Knowledge Base. The color intensity of miR expression indicates the degree of up-regulated (red) or down-regulated (green) miRs. This figure depicts a large merged network composed of three individual networks bridged by two key molecules, MAPK1 (ERK2) and MYC (highlighted by blue boxes), that are known regulators of cellular proliferation. Mature miRs selected for further analyses and their precursors are circled in magenta.

