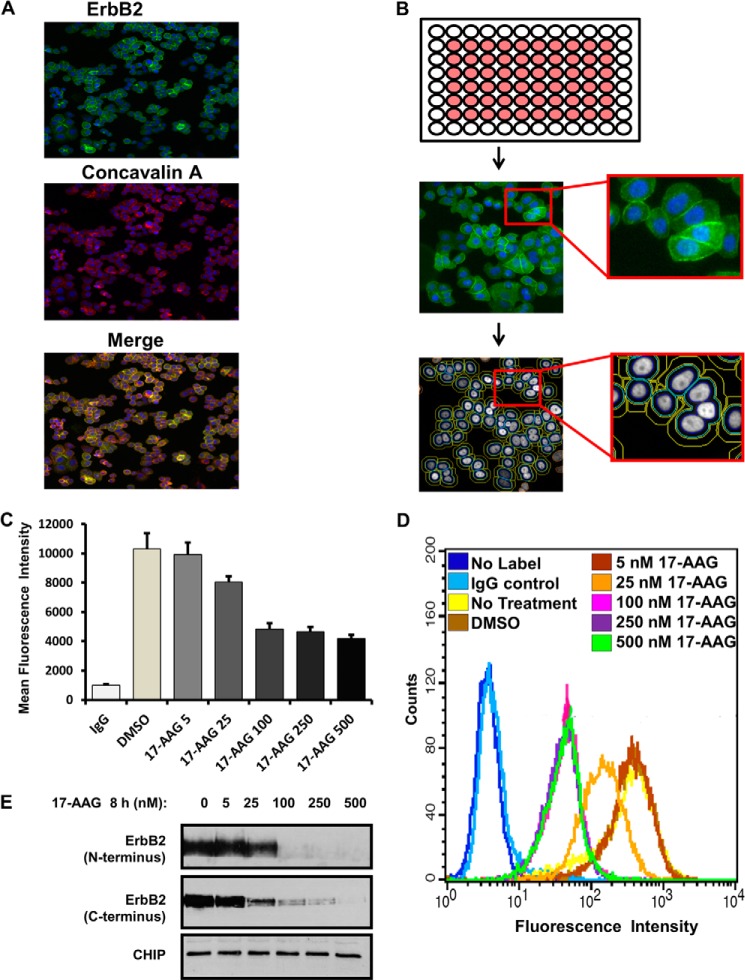
FIGURE 1.
Development of an automated high-content fluorescence imaging-based assay for the measurement of surface levels of ERBB2. A–C, SKBR-3 cells were seeded in duplicate in the inner wells of 96-well plates (B, schematic at the top), labeled with Alexa Fluor® 488-conjugated anti-ErbB2 for 1 h at 4 °C, treated with DMSO (vehicle control), or increasing concentrations (5–500 nm) of 17-AAG for 8 h and fixed in 4% paraformaldehyde. The plates were scanned in a CellomicsTM Arrayscan VTI fluorescent microscope imager (A, B) and the CellomicsTM compartmental analysis software was used to quantify the fluorescence intensity of ErbB2 at the plasma membrane (C). The Y-axis represents the mean fluorescence intensity ± S.D. The presented data are from a single experiment representative of three. D and E, SKBR-3 cells were seeded in 6-well plates for 72 h and treated with DMSO (vehicle control) or increasing concentrations (5–500 nm) of 17-AAG for 8 h. In D, cells were trypsinized, washed in FACS buffer, and live cells stained with Alexa Fluor® 488-conjugated anti-ErbB2 for 1 h on ice. Cell surface levels of ErbB2 were quantified using flow cytometry and analyzed using BD Cellquest™ software. X-axis, mean fluorescence intensity; Y-axis, cell counts. In E, Triton X-100 lysates were prepared, and 25-μg aliquots of lysate protein resolved by SDS-PAGE followed by immunoblotting with anti-ErbB2 and anti-CHIP (loading control) antibodies.

