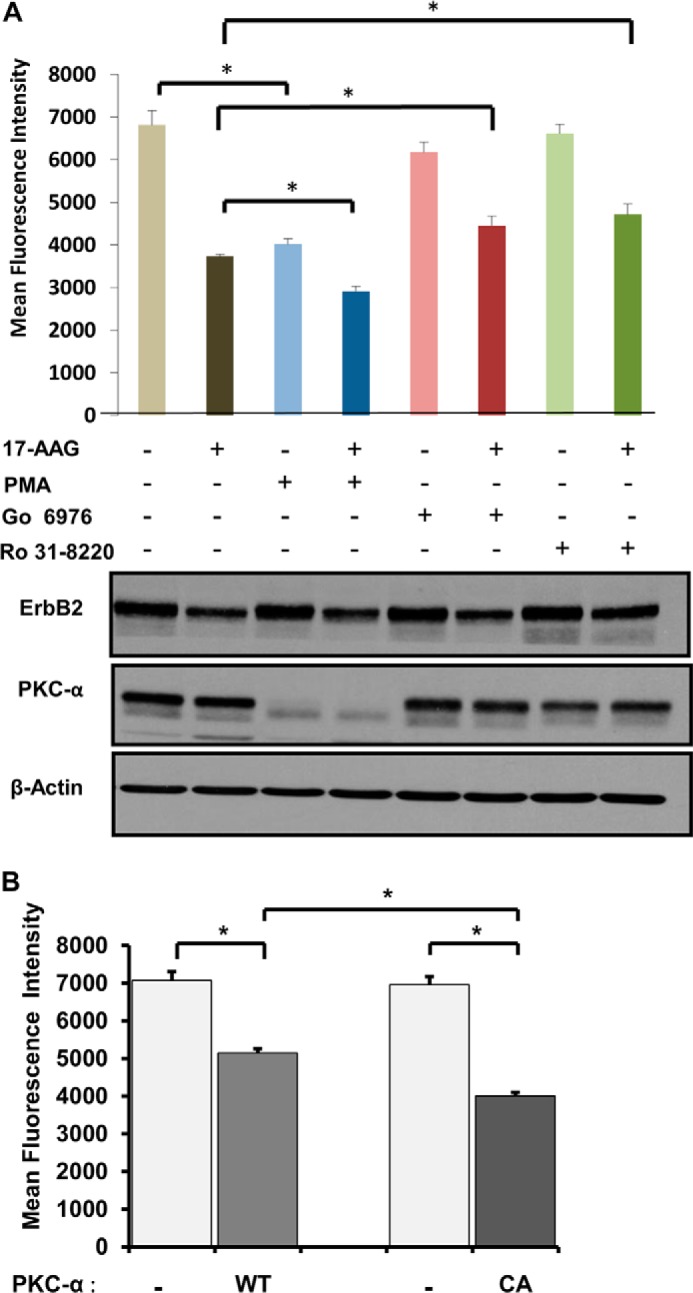
FIGURE 3.

Role of PKC-α in ErbB2 clearance from the cell surface. A, SKBR-3 cells were pre-treated with DMSO, Ro 31–8220 (1 μm), Go 6976 (1 μm), or PMA (100 nm) for 1 h, and incubations continued without or with 17-AAG (25 nm) for 8 h. Cells were trypsinized, stained with Alexa Fluor® 488-anti-ErbB2 antibody, and analyzed by FACS to quantify cell surface ErbB2 levels. The bars represent mean fluorescence intensity values ± S.D. Triton X-100 lysates were prepared from parallel cultures treated as those used for FACS and 25-μg aliquots of lysate protein resolved by SDS-PAGE followed by immunoblotting with anti-ErbB2, anti-PKC-α, and anti-β-actin (loading control) antibodies. The presented data are from a single experiment representative of three. B, SKBR-3 cells were transiently co-transfected with expression constructs encoding wild-type or constitutively active (CA) PKC-α together with dsRed plasmid. Live cells were stained with Alexa Fluor® 488 conjugated-anti-ErbB2, and cell surface levels of ErbB2 on ds-Red-negative (light bars) and ds-Red-positive (dark bars) cells were quantified using FACS. The mean fluorescence intensity values ± S.D. are presented; asterisks indicate statistically significant differences (p < 0.005). The presented data are from a single experiment representative of three.
