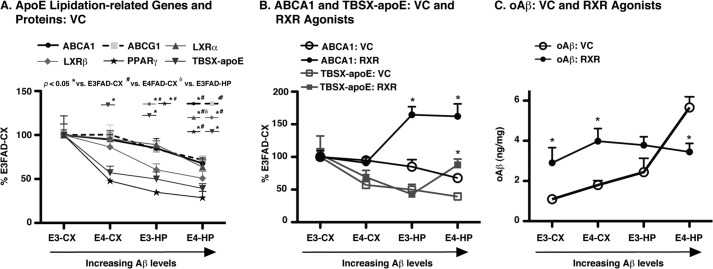
FIGURE 7.
Collective analysis, beneficial effects of RXR agonist treatment. A, protein levels of ABCA1, ABCG1, and TBSX-apoE, as well as the expression (mRNA) of LXRα, LXRβ, and PPARγ plotted across brain region as % E3FAD-CX for the VC control groups of T1 and T2. B, levels of ABCA1 and TBSX-apoE in the VC and RXR agonist treatment groups, Bex and LG combined (RXR), plotted across brain region as % E3FAD-CX. C, levels of oAβ (ng/mg protein) in the VC and RXR agonist treatment groups, Bex and LG combined (RXR), plotted across brain region. n = 12. *, p < 0.05 versus VC.

