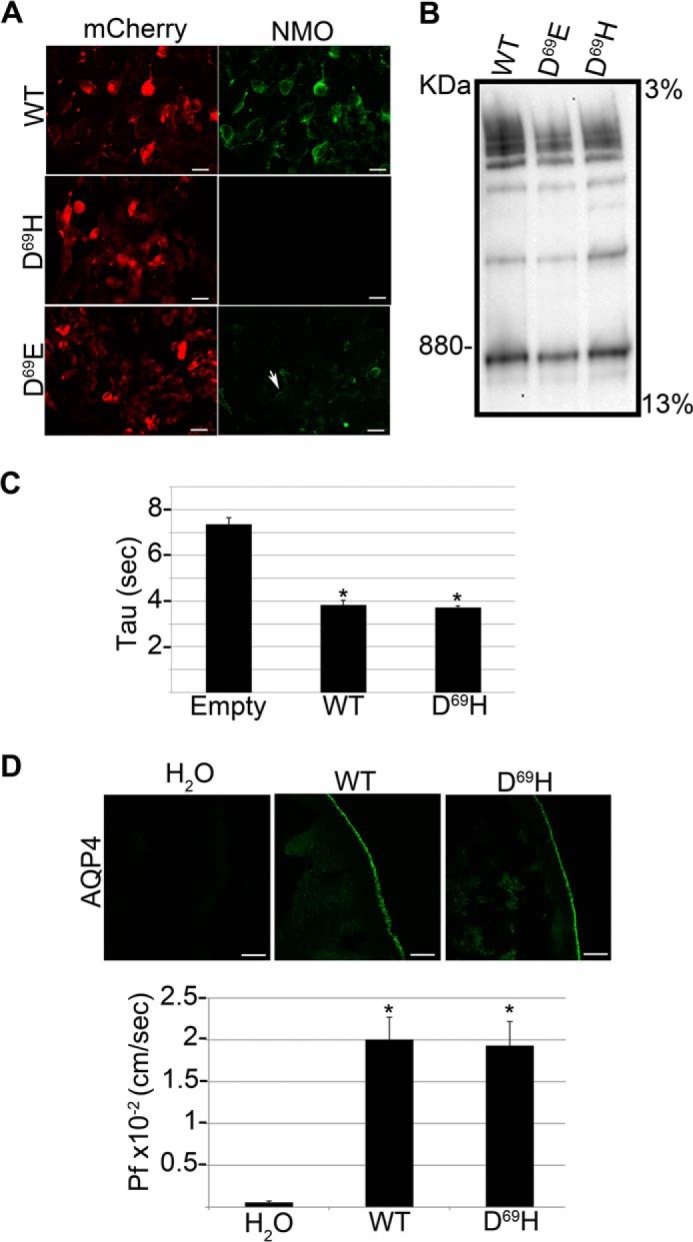
FIGURE 4.

Analysis of NMO-IgG binding, supramolecular aggregates, and water transport properties of AQP4 D69H and D69E. A, immunofluorescence images of NMO-IgG binding (NMO, green) on mCherry tagged (mCherry, red) wild-type (WT), AQP4 D69E and D69H. Note that NMO-IgG binding is absent in D69H and strongly reduced in AQP4 D69E. Scale bars, 10 μm. B, BN-PAGE followed by AQP4 immunoblotting analysis of the same transfected cells shown in A. The supramolecular aggregates formed by the mutants are grossly comparable with those formed by wild type AQP4. C, water transport measured by a fluorescence quenching assay using empty vector (Empty), wild type AQP4 (WT), and AQP4 D69H (D69H)-transfected cells. The histogram shows the mean ± S.E. of the time constant of cell shrinkage (Tau) expressed in seconds. Tau is comparable between WT and D69H expressing cells (*, p < 0.005 versus Empty, n = 10). D, top panel: AQP4 immunofluorescence analysis of X. laevis oocytes injected with water (H2O), wild type AQP4 cRNA (WT), and AQP4 D69H cRNA (D69H). Bottom, histogram showing the mean ± S.E. of the corresponding Pf value. Both AQP4 D69H plasma membrane expression levels and Pf values are comparable with the wild type AQP4 (*, p < 0.005 versus H2O injected, n = 10).
