
FIGURE 6.
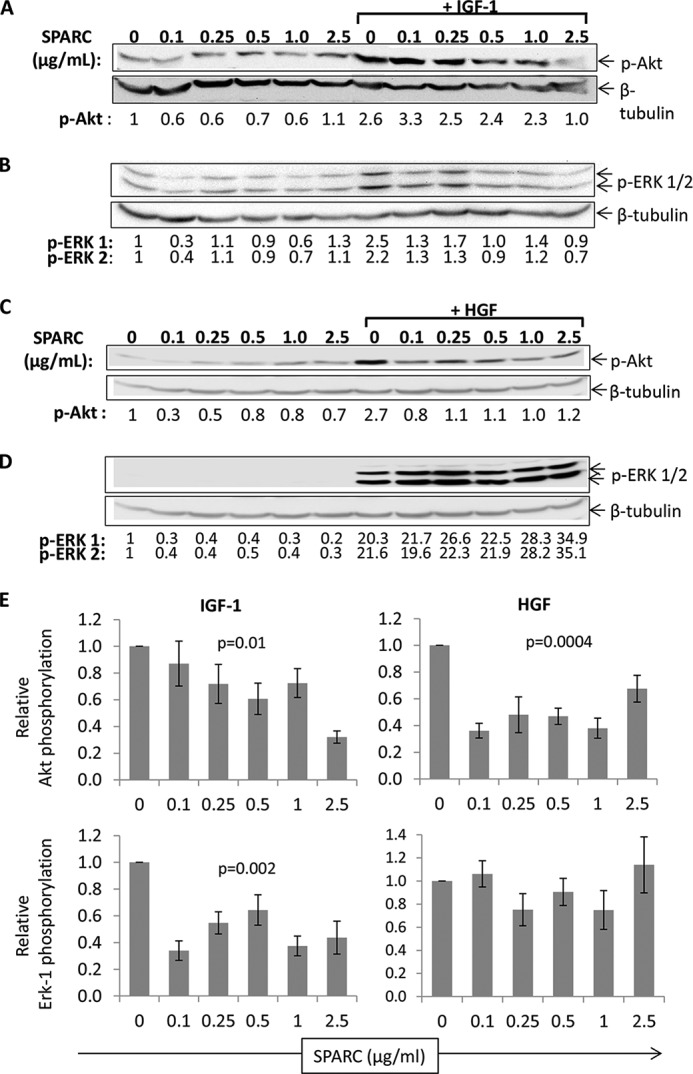
SPARC inhibits growth factor signaling in INS-1 β cells. INS-1 cells treated for 7.5 min with 20 ng/ml IGF-1 (A, B) or 20 ng/ml HGF (C, D) and the indicated concentration of SPARC were analyzed by Western blot to detect phosphorylated Akt (A, C), phosphorylated ERK 1/2 (B, D), and β-tubulin as a loading control. The numbers below the blot indicate band intensities standardized to β-tubulin and the untreated control in lane 1. Representative blots are shown in A–D. The graphs in E show pooled data from multiple experiments for samples treated with growth factor in addition to the indicated concentration of SPARC. Plots show mean ERK-1/Akt phosphorylation of samples treated with growth factor plus SPARC relative to growth factor alone ± S.E. (n = 3–6 for IGF-1 data, n = 5 for HGF data) p values indicate statistical analysis using one-way ANOVA.