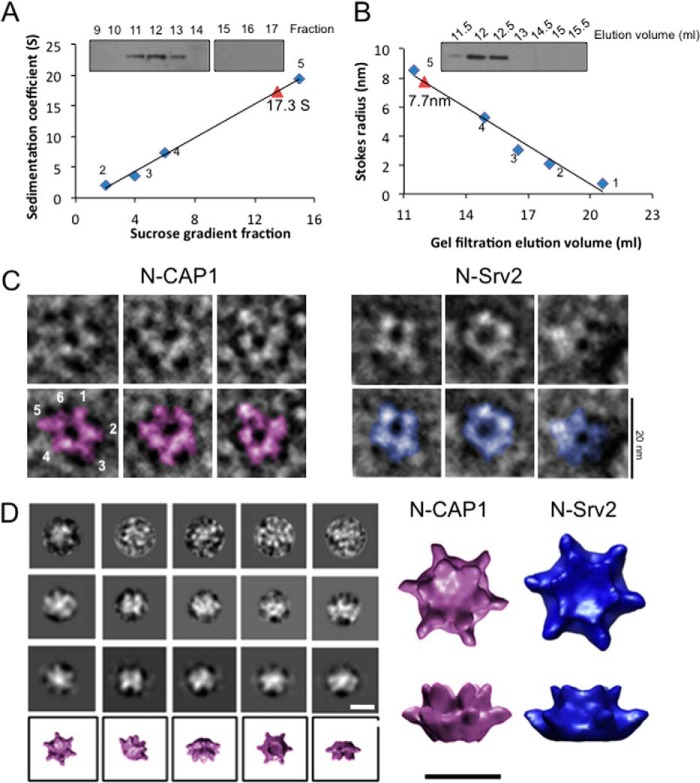
FIGURE 1.
Mammalian CAP1 forms a hexameric complex with 6-fold symmetry. A, sedimentation velocity analysis of endogenously expressed human CAP1. HEK293 cell lysates were fractionated on sucrose gradients, and fractions were immunoblotted with CAP1 antibodies. The sedimentation coefficient (S) for CAP1 (red triangle) was determined by comparison to size standards (blue diamonds): 1, thyroglobulin, MW, 670,000, 19.4S, 8.5 nm; 2, gamma globulin, MW, 158,00, 7.4S, 5.22 nm; 3, ovalbumin, MW, 44,000, 3.6S, 3.05 nm; 4, myoglobin, MW, 17,000, 2S, 2.08 nm; 5, vitamin B12, MW, 1,350, 0.75 nm). B, gel filtration analysis of endogenously expressed human CAP1 from HEK293 cell lysates. The Stokes radius (in nm) for CAP1 (red triangle) was determined by comparison to the same size standards as in A (blue diamonds). C, representative electron micrographs of negatively stained, purified mouse N-CAP1, and yeast N-Srv2. Bar, 20 nm. D, single particle analysis of mouse N-CAP1: raw images (top row), two-dimensional projections of class averages (middle two rows), and three-dimensional reconstructions of each class (bottom row). These data were used to generate a final three-dimensional reconstruction of N-CAP1, which is compared with the three-dimensional reconstruction of N-Srv2 previously determined (20). Bar, 10 nm.

