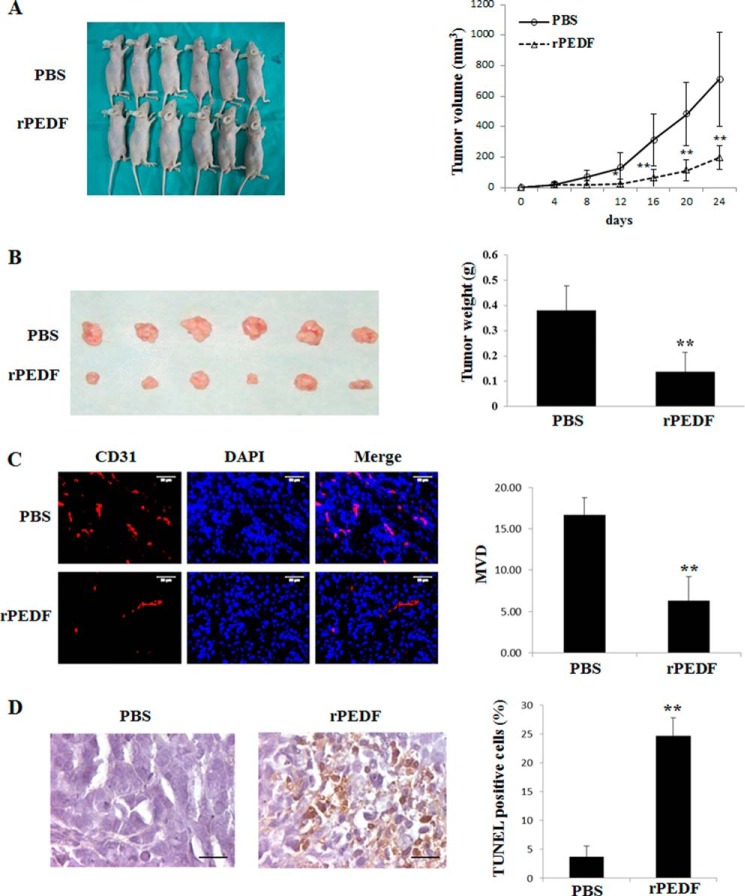
FIGURE 1.
Growth inhibition, angiogenesis repression, and apoptosis induction by rPEDF in A549 xenografts. A, mice received a total of five intraperitoneal injections of rPEDF (n = 6, bottom row) or the same volume of PBS (n = 6, top row) every other day beginning on day 8 post-transplantation. On day 24 after tumor inoculation, the mice were executed and photographed. Tumor volumes were measured every 2 days and are displayed as tumor growth curves. Data are mean ± S.D. *, p < 0.05; **, p < 0.01. B, tumor tissues from the executed mice. Top row, tissues from mice treated with PBS. Bottom row, tissues from mice treated with rPEDF. The weights of tumor tissues served as the inputs for the statistical analysis. Data are mean ± S.D. of 6 mice/group. **, p < 0.01 versus PBS control. C, frozen sections of tumor tissues were subjected to immunohistochemical staining with an endothelial-specific antibody against CD31. Typical pictures of CD31-positive vessels are shown. Quantitative analysis of the CD31-positive vessels was then performed. In all samples, the mean number of microvessels was calculated from the five vascular hot spots. Data are mean ± S.D. **, p < 0.01 versus PBS control. Scale bars = 50 μm. MVD, microvessel density. D, representative photographs of apoptotic cells generated by TUNEL (brown) assay in paraffin sections of tumor tissues. The nuclei were counterstained with hematoxylin. A quantitative analysis of the apoptotic cells percentage in tumor tissues was performed. **, p < 0.01 versus PBS control. Scale bars = 50 μm.

