FIGURE 10.
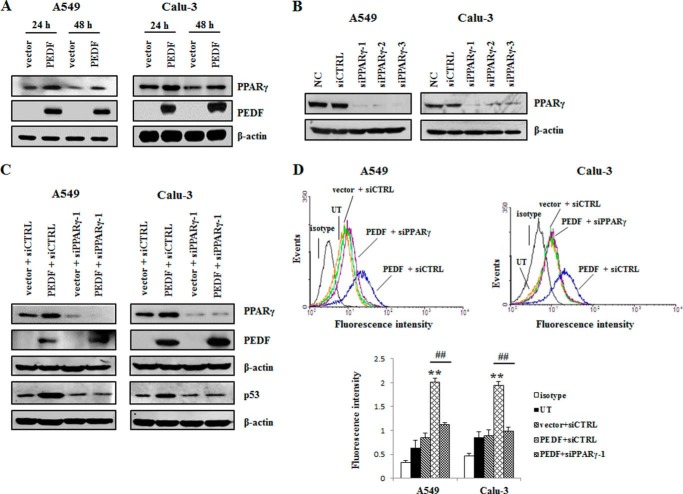
PPARγ contributes to the up-regulation of p53 by PEDF. A, cells were harvested after transfection with pcDNA3.1 (+) or PEDF-pcDNA3.1 (+) for 24 h and 48 h in the absence of serum. Next, the cells were subjected to Western blot analysis. The protein levels of PPARγ and PEDF were detected with PPARγ and PEDF antibodies, respectively. B, cells were transfected with PPARγ siRNAs (siPPARγ-1/2/3) or a nonspecific control siRNA (siCTRL) for 48 h. siRNA-mediated depletion of PPARγ was examined by Western blot analysis. NC, normal control. C, knockdown of PPARγ was performed 24 h prior to the overexpression of PEDF. Western blot analysis was used to determine the protein levels of p53, PEDF and PPARγ. D, in parallel experiments, flow cytometry was employed to measure cell surface Fas using FITC mouse anti-human CD95 (Fas). Representative flow cytometry histograms are presented as above. Data are mean ± S.D. **, p < 0.01 versus vector + siCTRL group; ##, p < 0.01 versus PEDF + iCTRL group. UT, untreated group. Data are representative of three independent experiments.

