FIGURE 3.
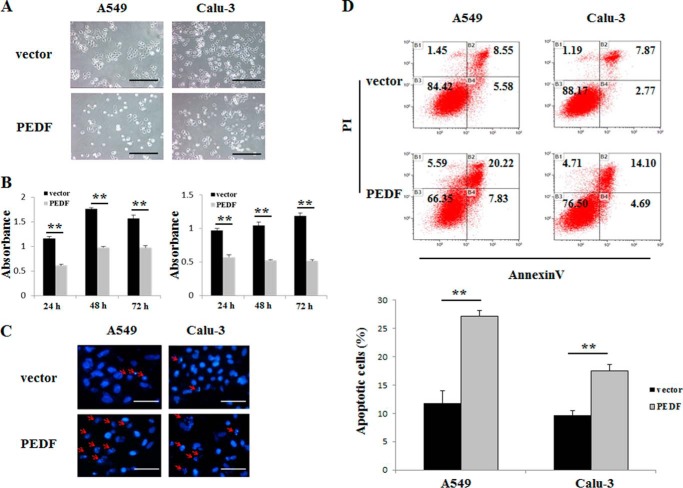
Effects of PEDF overexpression on cell viability and apoptosis in A549 and Calu-3 cells. A, typical photographs of cells transfected with vector (top row) or PEDF (bottom row) for 48 h after serum depletion. Data are representative of three independent experiments. Scale bars = 50 μm. B, 3-(4,5-dimethylthiazol-2-yl)-2,5-diphenyltetrazolium bromide assay for the viability of cells transfected with vector or PEDF for 24, 48, and 72 h after serum depletion. Data represent absorbance at 570 nm and are mean ± S.D. of quadruplicates. **, p < 0.01 versus the vector-only group. Data are representative of three independent experiments. C, after transduction of vector (top row) or PEDF (bottom row) for 48 h in the absence of serum, the cells were harvested for Hoechst staining. Representative pictures from three independent experiments photographed at ×200 are shown. The apoptotic cells were identified by chromatin condensation and nucleus fragmentation (red arrows). Scale bars = 200 μm. D, in parallel experiments, the samples were subjected to FITC-annexin V/propidium iodide staining, and a quantitative analysis of apoptotic cells was performed using flow cytometry. Diagrams of the FITC-annexin V/propidium iodide flow cytometry in a representative experiment are presented. Quantifications of the apoptotic cells are shown as mean ± S.D. of triplicates. **, p < 0.01 versus the vector-only group.

