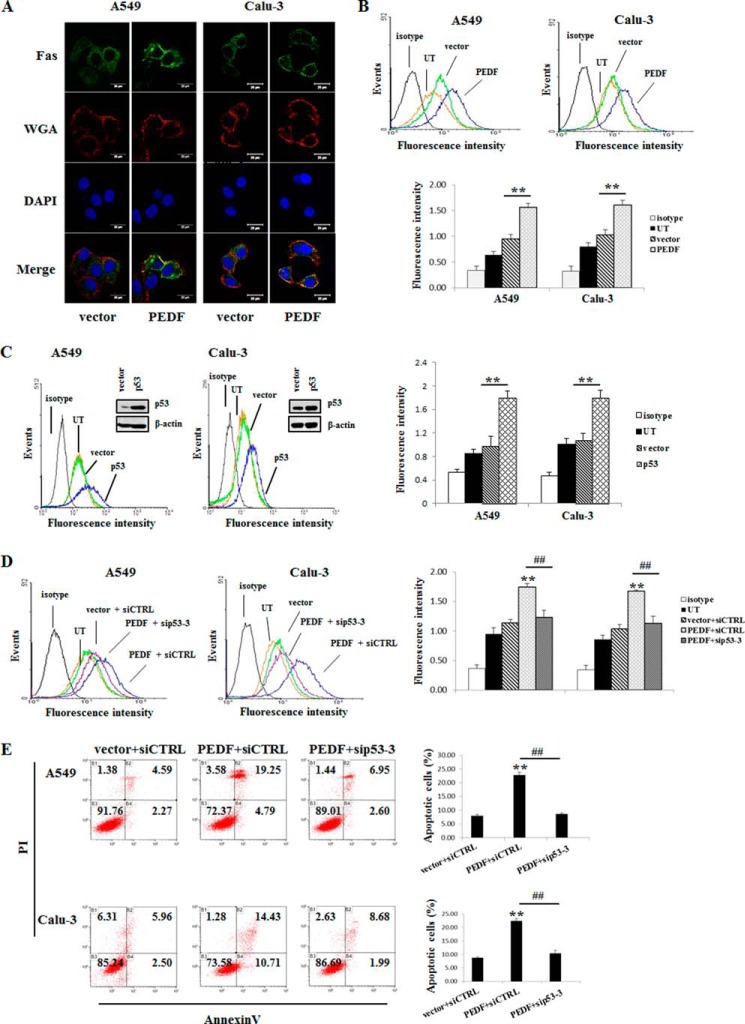
FIGURE 8.
PEDF up-regulates cell surface Fas via p53-mediated translocation. A, confocal microscopy of the Fas immunofluorescence assays. Fluorescence images were acquired 48 h post-transfection of the PEDF gene after depletion of the serum. Green, Fas; red, WGA; blue, DAPI. Data are representative of three independent experiments. B, PEDF induced cell surface Fas as determined by flow cytometry. Representative histograms of three independent experiments are shown. The results are shown as mean ± S.D. of triplicates. **, p < 0.01 versus the vector-only group. UT, untreated group. C, cells were transfected with p53-pcDNA3.1 (+) for 48 h. Western blot analysis was performed to determine the protein levels of p53. Cell surface Fas was measured by flow cytometry. Representative histograms of three independent experiments are shown. The results are shown as mean ± S.D. of triplicates. **, p < 0.01 versus the vector-only group. D and E, knockdown of p53 was performed 24 h prior to the overexpression of PEDF. Cells were collected for cell surface Fas (D) and apoptosis evaluation (E) by flow cytometry. Representative flow cytometry histograms of three independent experiments are presented as above. Data are mean ± S.D. of triplicates. siCTRL, control siRNA. **, p < 0.01 versus vector + siCTRL group; ##, p < 0.01 versus PEDF + siCTRL group. PI, propidium iodide.

