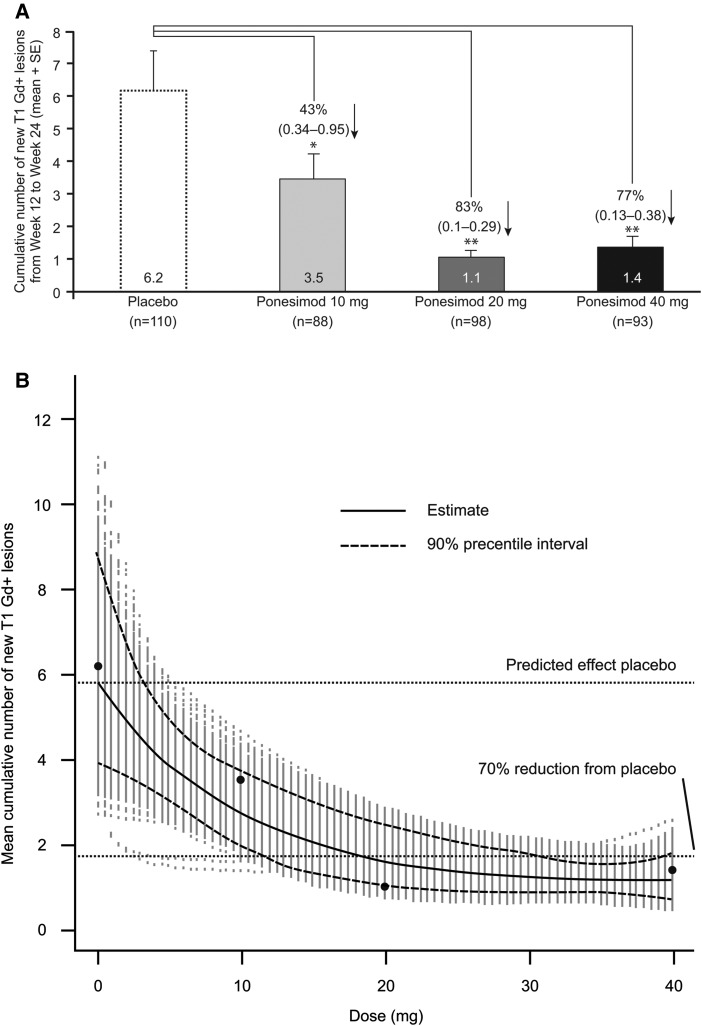
Figure 3.
(A) Cumulative number of new T1 Gd+ lesions detected by magnetic resonance image scanning at weeks 12–24 (per-protocol analysis set). Graph shows mean+SE. The percentage reduction (95%CI) versus placebo is shown for each ponesimod treatment group. (B) Dose–response analysis for the cumulative number of new T1 Gd+ lesions from week 12 to 24 (per-protocol analysis set). Black dots represent the mean value for each dose and grey dots represent the fitted models obtained in the bootstrap process. *p<0.05; **p<0.0001. T1 Gd+, T1-weighted gadolinium-enhanced.

