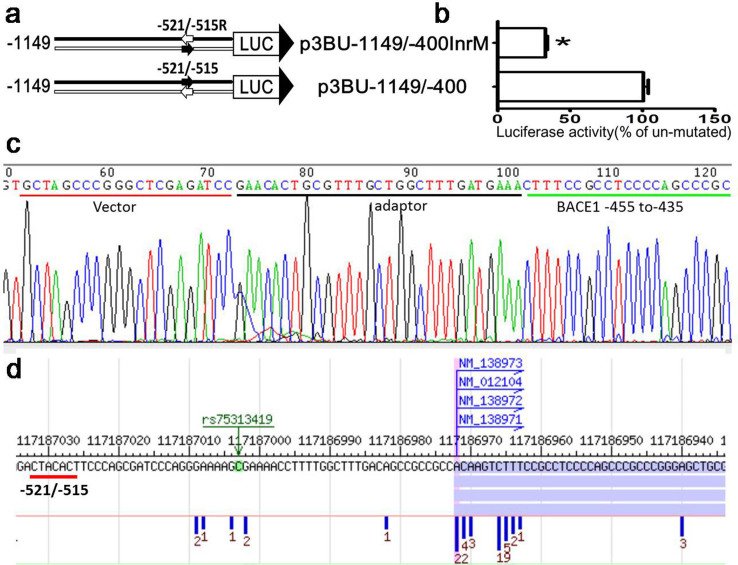
Figure 6. TCE2 is not an initiator of BACE1 gene.
(a) Schematic diagram of plasmid constructs. The two horizontal lines indicate two DNA strands of the BACE1 promoter region; the box LUC with large arrowhead represents the coding sequence of the luciferase reporter gene and transcriptional direction; small arrow indicates tested DNA motif The numbers indicate the endpoints of each construct, with +1 as the adenine of the physiological translational start codon of the BACE1 gene. (b) HEK293 cells were transiently transfected reporter plasmids. Firefly luciferase activity was measured 24 h after transfection, and Renilla luciferase activity was used to normalize for transfection efficiency. Data are shown as percentage of control samples transfected with wild-type plasmid. The values represent means standard error of the mean (n = 6). * P< 0.05 by analysis of t-test when comparing with control. (c) Sequencing result of the 5′ RACE product which was cloned into the pGL3-Basic vector. Sequence of the vector, adaptor and BACE1 5′UTR are shown underlined. The first nucleotide cytosine next to the 3′ of the adaptor is the TSS of human BACE1 gene. (d) TSS distribution of BACE1 gene in HEK293 cell from dbTSS(http://dbtss.hgc.jp/).The number under vertical blue bar represent TSS frequency identified from massively parallel sequencing of TSS.

