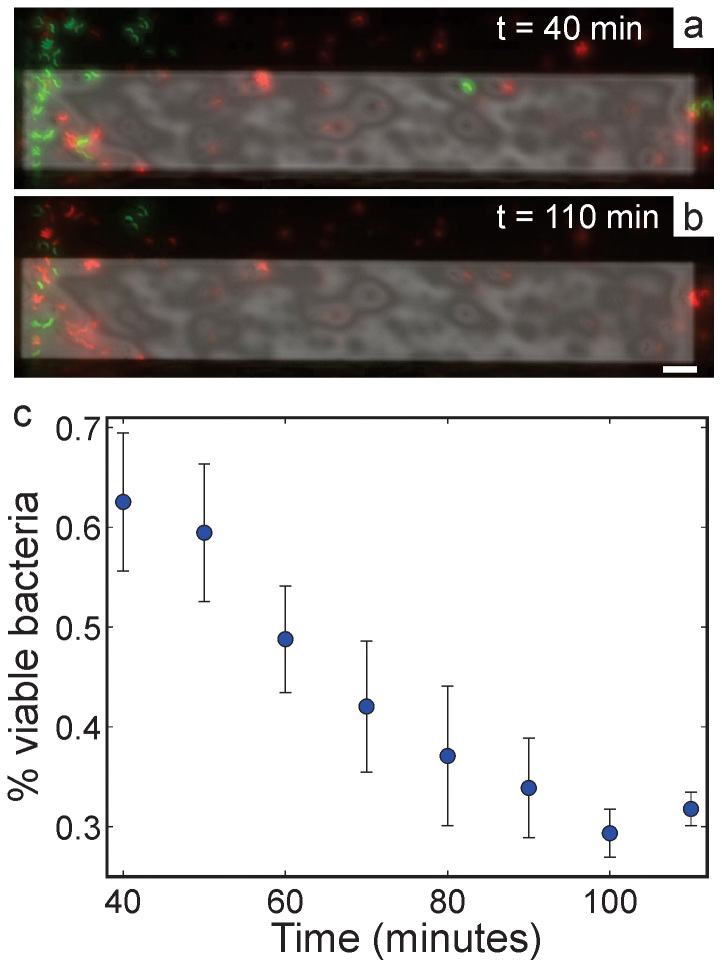
Figure 6. Composite fluorescence images of stained cells of M. magneticum (a) 40 minutes and (b) 110 minutes after sealing the fluid cell tip.
The scale bar in (b) is 10 μm. (c) Percentage of cells with intact membranes (green fluorescence only) as a function of time from fluid cell assembly. Percent viability is determined by dividing green fluorescent bacterial cells by the total number of bacteria cells in the fluid cell. Each data point is the mean of three trials, the error bars are two standard deviations of the mean.

