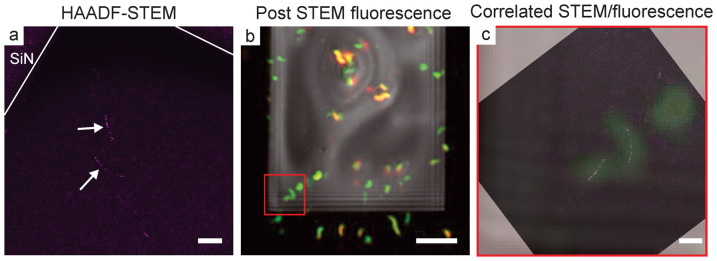
Figure 7. Correlative fluorescence and STEM imaging of viable cells of M. magneticum.

(a) False colored, background subtracted HAADF-STEM image of two bacterial cells near the corner of the SiN window, the magnetosome chains appear in purple and are denoted with white arrows. (b) Post-STEM composite fluorescence image of the same fluid cell sample. (c) Correlated STEM and composite fluorescence image of the bacterial cells highlighted in the red box in (b). The scale bar is 1 μm in (a) and (c) and 10 μm in (b).
