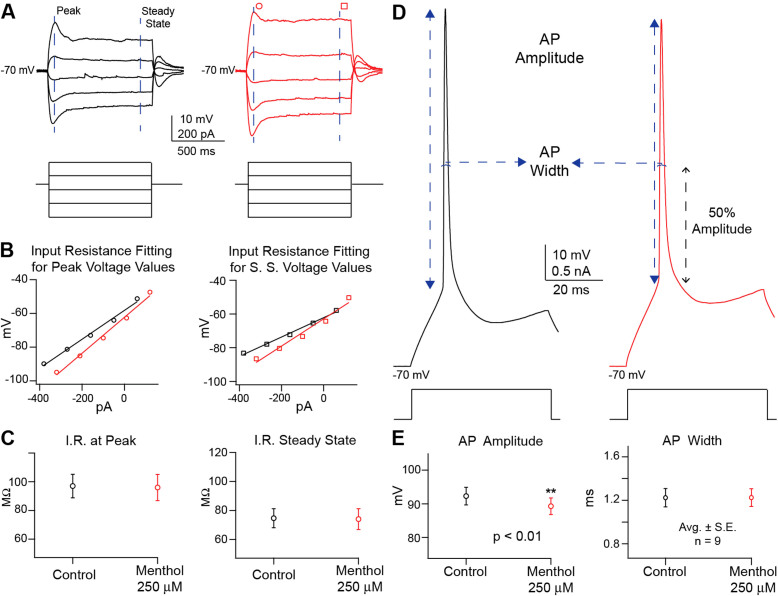
Figure 3. Analysis of menthol 250 μM effects on neural activity through current stimulation.
The recordings of I/V analysis set of stimuli (A) provided voltage values (top traces) at peak and at steady state for control (black) and in the presence of menthol 250 μM (red; circle for peak voltage values and square for steady state.) at each level of current injected (bottom traces). Data was plotted for each cell and input resistance was obtained from both voltage levels for both conditions (B) by linear fit. When compared, (C) the input resistance at peak voltage and at steady state show no statistical difference between control (black) and in the presence of menthol 250 μM (red) (n = 9 average ± S.E.; assessed by Student's t-test). Action potential waveform analysis features, amplitude and width, were obtained from high sampling (20 kHz) voltage traces (D top traces) from control (black) and menthol 250 μM (red) conditions while applying square current pulses (bottom traces). Values were plotted and compared (E) presenting no statistical difference (n = 9 average ± S.E.; assessed by Student's t-test).

