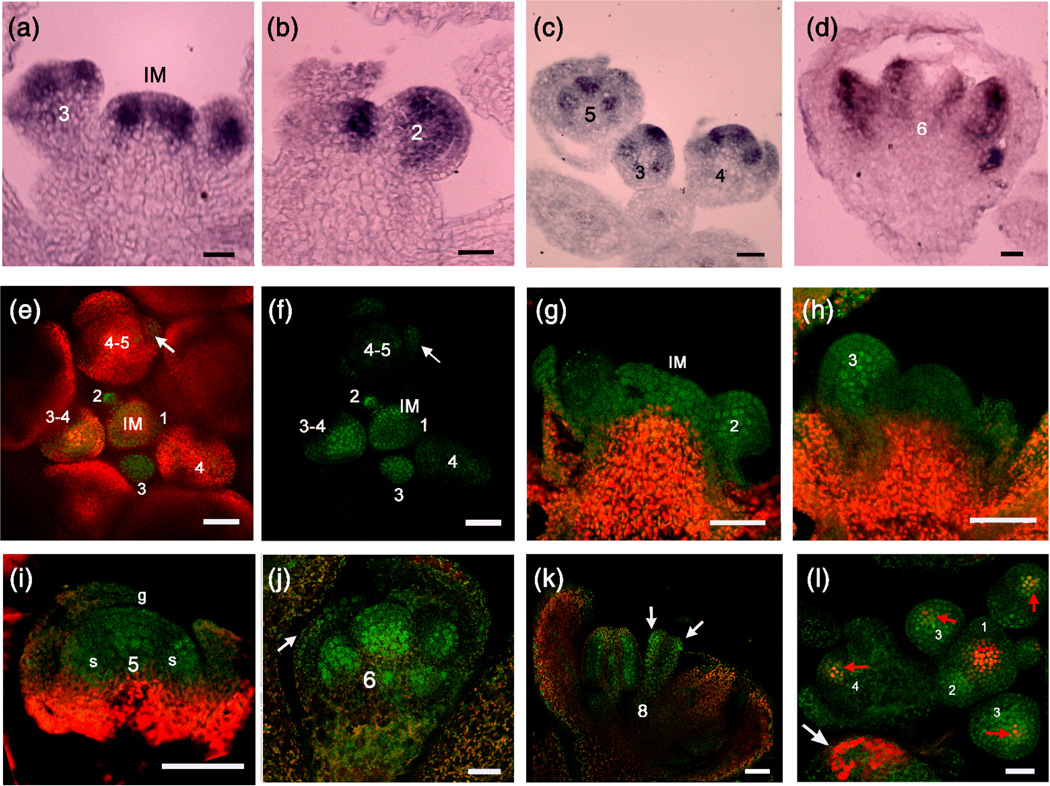
Figure 4. ARF3 RNA and protein distribution in flowers.
(a–d) in situ hybridization with an ARF3 antisense probe. ARF3 expression patterns in the IM and stage 3 (a), stage 2 (b), stage 5 (c) and stage 6 (d) FMs are shown. Numbers indicate the developmental stage.
(e,f) A global view of ARF3-GFP signal distribution in the FM and floral organ promordia during early floral development as observed with a confocal microscope (e: GFP and chlorophyll fluorescence merged channels; f: GFP channel alone). Numbers indicate the developmental stages of the FMs, and the arrow indicates GFP signal in a sepal primordium. Note that the GFP signal is present in the center of the IM but is masked by the strong chlorophyll fluorescence.
(g–k) ARF3-GFP signal in the IM and stage 2 (g), stage 3 (h), stage 5 (i), stage 6 (j) and stage 8 (k) FMs and flowers. Numbers indicate the floral developmental stage. The arrow in (j) indicates GFP signal in a sepal, and the arrows in (k) indicate the abaxial distribution of ARF3-GFP signals. g: gynoecium; s: stamen. Note that in (g) to (i), the regions showing strong chlorophyll fluorescence (red) also had GFP signals, which were masked by the red fluorescence.
(l) Coexpression of ARF3 and WUS in the FM. ARF3∷ARF3-GFP (green) and WUS∷DsRed-N7 (red) were detected in an ARF3∷ARF3-GFP WUS∷DsRed-N7 inflorescence using a confocal microscope, and the signals were merged. Red arrows indicate coexpression regions, and the white arrow indicates chlorophyll autofluorescence. Numbers indicate the floral developmental stage.
Bars: 50µm in (a,b) and (e–j); 25µm in (c,d) and (k,l).

