
Fig. 4.
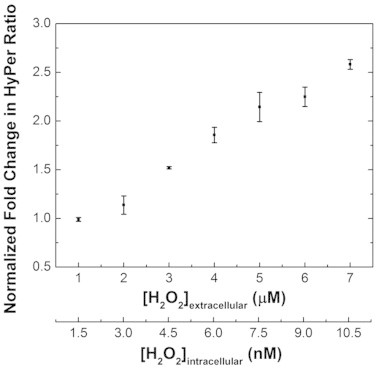
Calibrating HyPer’s ratiometric fluorescent response to hydrogen peroxide. The excitation spectra of cell suspensions containing 2.5 × 10⁵ cells/mL treated with 0–7 µM hydrogen peroxide were measured at 2-min intervals with excitation from 410–510 nm and emission monitored at 545 nm. The peak of the response was noted. Ratiometric responses (Excitation 500 nm/420 nm) were calculated at the peak. This ratio was divided by the baseline ratio before addition of hydrogen peroxide, and normalized to the case where an equal amount of buffer without hydrogen peroxide was added to obtain the normalized fold change values. The error bars for each data point represent 95% confidence intervals. In order to determine the corresponding intracellular hydrogen peroxide concentration for each HyPer response, the extracellular concentration is divided by 650, the estimated gradient of hydrogen peroxide across the plasma membrane.