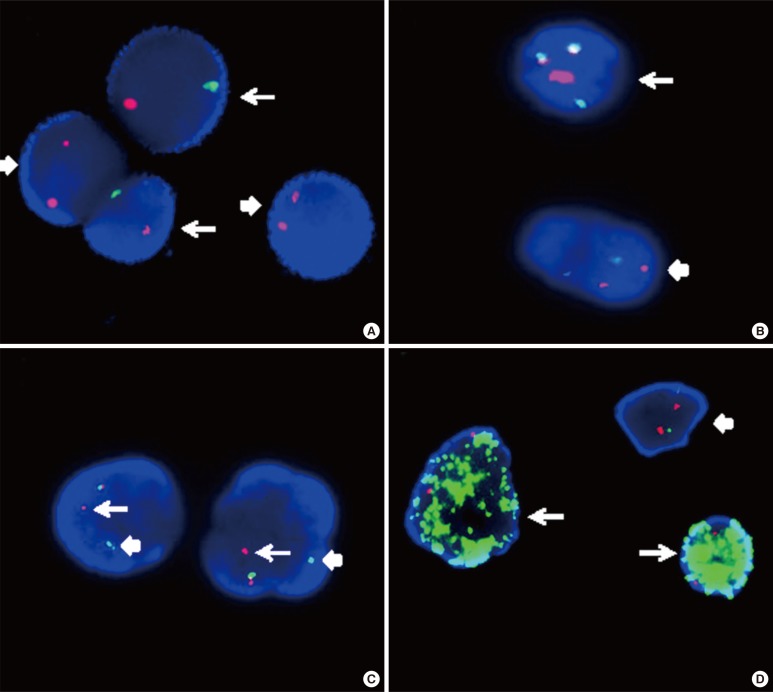
Fig. 4.
Interphase FISH images. (A) Interphase FISH using dual color centromeric-specific probes for chromosomes X (red) and Y (green) to determine the proportion of donor cells in the peripheral blood of the recipient (XY, arrow; XX, block arrow). (B) Interphase FISH using a dual color dual fusion BCR-ABL1 translocation probe, showing a 2G2R pattern in a normal cell (block arrow) and 1G1R2F in a Philadelphia-positive cell (arrow). (C) Interphase FISH using a dual color breakapart MLL translocation probe, showing an MLL split signal (distal MLL region, arrow; proximal MLL region, block arrow), and indicating MLL gene rearrangement. (D) MYC amplification in a neuroblastoma (arrow) and a normal cell with a 2G2R pattern (block arrow). The MYCN gene is labeled with a green fluorochrome, whereas the centromeric probe for chromosome 2 is labeled with a red fluorochrome.

