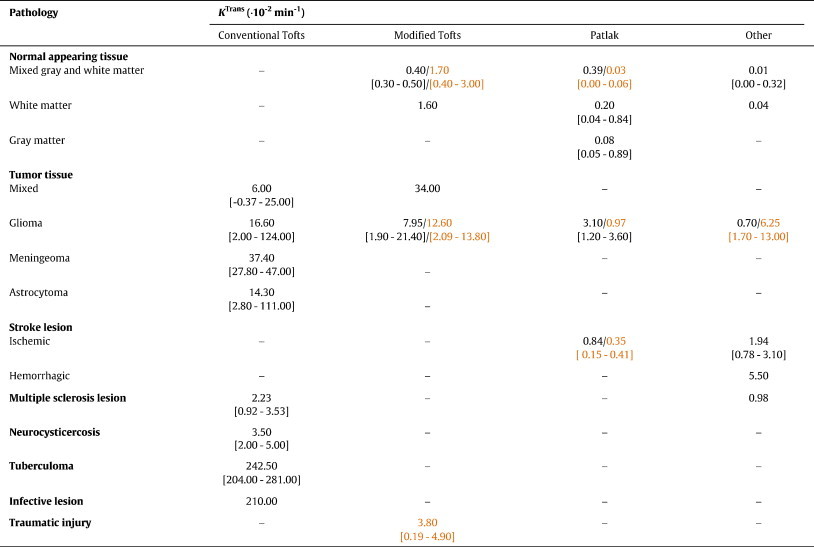
Table 2.
KTrans values reported for different tissue types and pharmacokinetic models. Given values are the median [range] of reported study sample means from human (in black) and animal (in orange) studies. Please note that some subjects included in these studies (e.g. high grade glioma patients) underwent treatment before entering the study. Hence, the reported baseline parameters might be influenced by interventions that were not the focus in the study.